
Spread law of loose coal combustion under lateral wind flow conditions on the surface
-
摘要:
煤的自燃特性使其在开采、存储和运输过程中存在火灾事故隐患,极大地阻碍了煤炭行业的可持续发展. 通过自主搭建的敞车载运煤燃烧蔓延模拟实验装置,分析在表面横向风流作用下的松散煤体内部高温区域演变以及气体蔓延规律. 结果表明,表面横向风流明显加快了本文实验煤样内部高温区域蔓延速度,相比无风状况下,高温蔓延速度加快了0.3倍(风流1 m·s−1时)和0.5倍(风流2 m·s−1时),高温区域峰值温度升高了120±20 ℃;受表面横向风流影响,燃烧蔓延路径向风流流动方向偏移;在风流0 m·s−1时,燃烧的高温点O2体积分数快速下降阶段所经历的时间随纵深的增加逐渐增大,风流作用会加剧煤氧反应. 研究成果可为煤炭在运输与储存过程煤火灾害形成规律研究提供参考借鉴.
Abstract:Spontaneous combustion of coal increases the risk of fires during its storage and transportation, posing a challenge to the sustainable development of the coal industry. This study employs various similarity criteria, including geometric, time, kinematic, dynamical, Euler’s, Strohal’s, Vernold’s, and Reynolds’ criteria, to investigate the rules of the spread of loose coal body combustion under wind flow conditions using a self-built, open-vehicle coal transportation simulation experimental device. The device recreates the temperature rise process in loose coal bodies, the formation of high-temperature areas, and their subsequent spread. It also analyzes the internal high-temperature area spread and gas distribution rules under wind flow. During the experiment, the temperature of each measurement point changed as the constant temperature time increased, with the measurement points closer to the heat source showing a significant temperature increase compared with those farther away. The experiments were conducted for 70, 54, and 48 h under wind flows of 0, 1, and 2 m·s−1, respectively. The results reveal that the crosswind flow on the surface significantly accelerates the spread of the seed of coal sample combustion. Compared to wind flow at 0 m·s−1, the high-temperature area spread time is 0.3 times quicker (wind flow at 1 m·s−1) and 0.5 times quicker (wind flow at 2 m·s−1); moreover, the maximum temperature of the high-temperature area increases by 120 ± 20 ℃, eventually stabilizing at 510 ℃–560 ℃. The spreading path of the high-temperature area drifts toward the wind under the influence of crosswind flow on the surface. When the wind flow is 0 m·s−1 the difference between the time when the CO concentration peaks at the critical point of each layer and when the critical point reaches 300 ℃ (Δh1) gradually increases with the number of layers. However, under the effect of wind flow, Δh1 is maintained at 1.4 ± 1 h (wind flow at 1 m·s−1) and 0.9 h (wind flow at 2 m·s−1), thus intensifying the coal–oxygen reaction and causing the combustion to spread more rapidly. For each critical point of the oxygen volume fraction of the layers, the time elapsed during the rapid decline phase of the O2 volume fraction at the high-temperature point of combustion gradually increases with depth. When the wind flow is 0 m·s−1, the difference between the time to reach the limiting O2 volume fraction at the critical point and the time to reach 300 ℃ at the critical point (Δh2) increases with depth. However, under the effect of wind flow, Δh2 is maintained at 0.6 ± 0.3 h (wind flow at 1 m·s−1) and 1 ± 0.2 h (wind flow at 2 m·s−1), indicating that surface airflow can exacerbate the rate of O2 consumption during the downward spread of high temperatures. Therefore, controlling air leakage can delay the spread of coal fires. These findings offer valuable insights for developing guidelines to control coal fires during coal transportation and storage.
-
煤炭自燃现象早在数万年前就普遍存在,人类的开采和利用使其范围扩大化和严重化[1−2]. 据不完全统计,我国每年因自燃问题所损失的煤炭资源超过2000万吨,其经济损失巨大[3−4]. 煤自燃不仅造成了资源的浪费,同时产生的CO、CO2等气体严重污染着人类生存环境,导致局部滑坡、坍塌等灾害,威胁着煤矿人员的生命安全[5−6].
煤炭自燃不仅是矿井开采面临的主要灾害之一,在运输和贮存过程中煤炭自热和自燃现象也普遍存在[7−8]. 如2020年7月,汕煤高速出口广场一辆满载煤炭的大货车发生煤自燃;2019年11月一艘满载煤炭的散货轮在卸货期间发生自燃;2017年2月,新疆阿勒泰318省道至北屯路段,两辆满载煤炭的大货车发生煤自燃等. 煤炭在运输过程中自燃规律的主要原因是,一方面车厢为煤体提供了适宜的蓄热空间;另一方面在运输过程中,车厢表面风流为煤体内部提供充足的空气,致使反应可以持续进行[9−10].
风流大小对煤氧化自燃特性的影响在许多文献中得到验证. 例如,费金彪和文虎[11],采用自行搭建的煤自燃实验系统研究风量对煤低温氧化的影响,发现随着风量的增加,煤在低温氧化后产生的CO气体浓度降低,且变化规律呈台阶式递减. 周西华等[12]通过煤自燃程序升温实验研究发现,煤自燃极限参数在不同温度阶段受供风量的改变影响较大,供风量的增大将导致自燃极限参数向更容易引发自燃的方向推进. 邢震[13]通过建立采空区模型,研究地表漏风对采空区煤自燃危险区的影响,结果表明地表漏风量越大,煤自燃区域向采空区进风测与深部蔓延,煤自燃危险区域宽度增加. 郝宇和逄锦伦[14],齐庆杰等[15]研究了不同供风量采空区煤自燃的范围,发现随着风速的增加,采空区进、回风两侧煤自燃的范围明显增大,同时自燃边界向采空区深部蔓延,加大防灭火治理工作的难度.
基于以上分析,学者们对煤在开采时容易引起煤自燃的风流影响因素进行了大量研究,但是在煤炭运输过程中的自燃问题还很少被探究. 本文通过搭建敞车载运煤炭相似实验装置,研究松散煤体内部高温受表面横向风流影响时的蔓延规律以及气体分布情况,从而确定松散煤体内部聚集热量的区域. 研究成果能够完善煤炭自燃发展演化机制,为煤炭运输过程煤自燃灾害防治提供参考价值.
1. 材料和方法
1.1 实验煤样
选取我国陕北地区某低变质易自燃煤样作为实验煤样,现场采集大块煤样密封处理后运送至实验室,在常温、常压下对煤样进行破碎筛分处理. 实验煤样的工业分析和元素分析结果如表1所示,其中Mad为空气干燥基水份;Vad为挥发分;Aad为灰分;FCad为固定碳. 实验煤样粒径分布如表2所示.
表 1 煤样工业分析和元素分析Table 1. Proximate and ultimate analysis of coal sampleProximate analysis (mass fraction)/% Ultimate analysis (mass fraction)/% Mad Vad Aad FCad C H O N S 11.2 23.1 7.86 57.84 62.96 2.56 33.24 0.69 0.55 表 2 实验煤样质量及粒径分布Table 2. Particle size distribution and mass of coal samplesExperimental Coal particle size/ mm Coal sample mass/g Temperature-programmed experiment 0–0.9, 0.9–3, 3–5, 5–7, 7–10 Each 200 Similar simulation experiment of gondola car transporting coal 7–10 60000 1.2 实验部分
1.2.1 程序升温实验
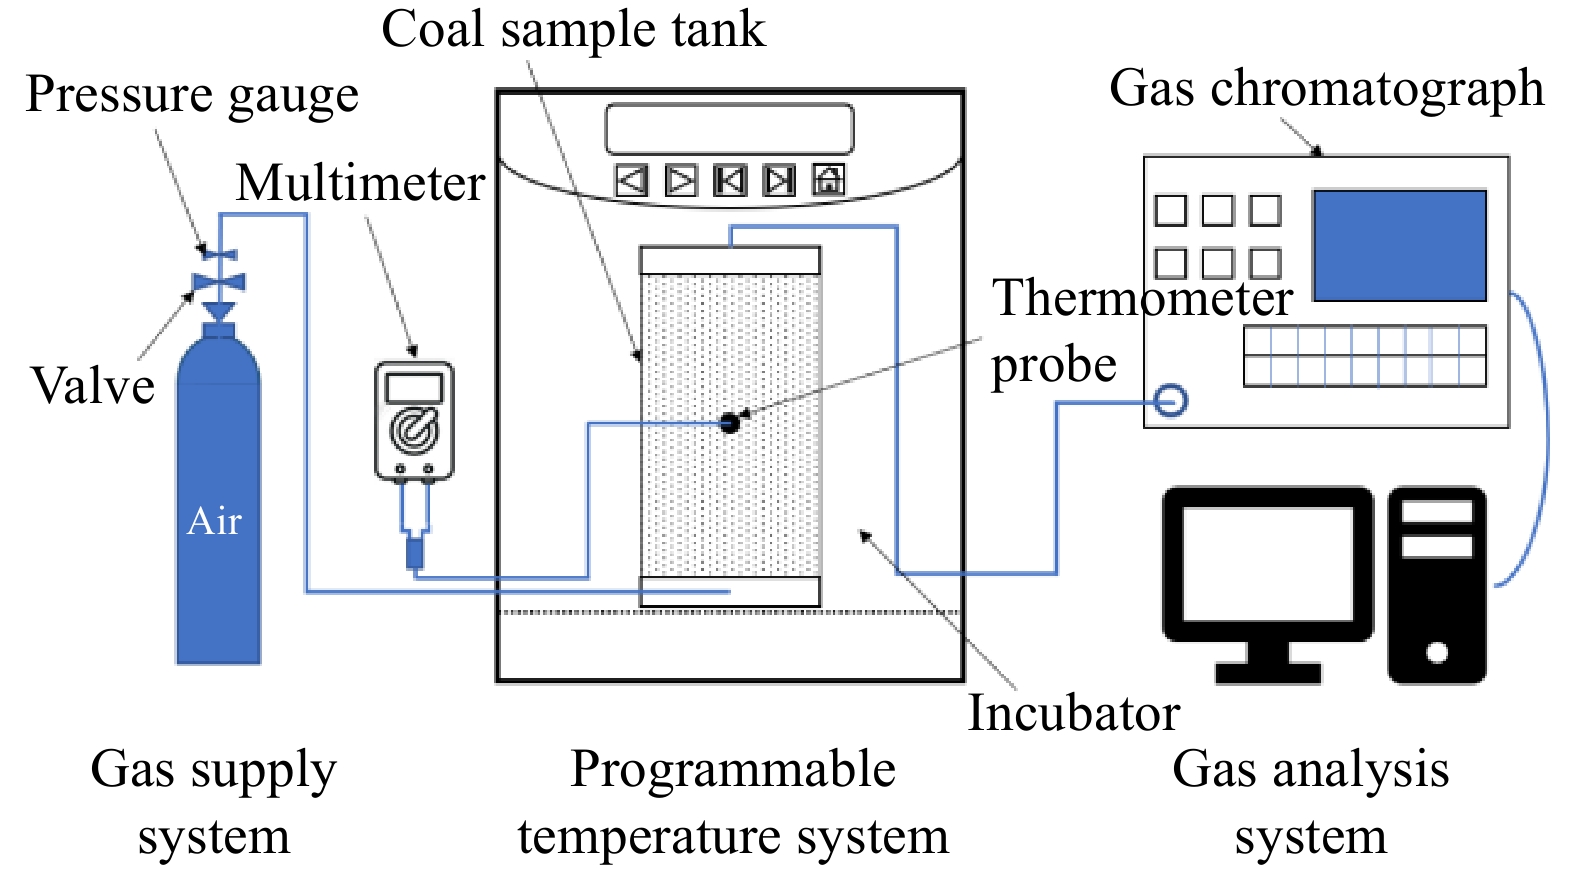
采用西安科技大学自主研制的XK-Ⅱ型煤自燃程序升温与气相色谱联用实验系统,如图1所示. 实验装置主要由:程序升温箱、样品罐、温度控制系统、气路控制系统和气相色谱仪5部分组成.
实验过程中,空气流量设定为120 mL·min−1,升温速率为0.3 ℃·min−1,温度控制范围为30~170 ℃. 随着温度的升高,采集煤样不同温度段下的气体产物,色谱分析其成分以及浓度.
1.2.2 煤自燃敞车载运相似模拟实验
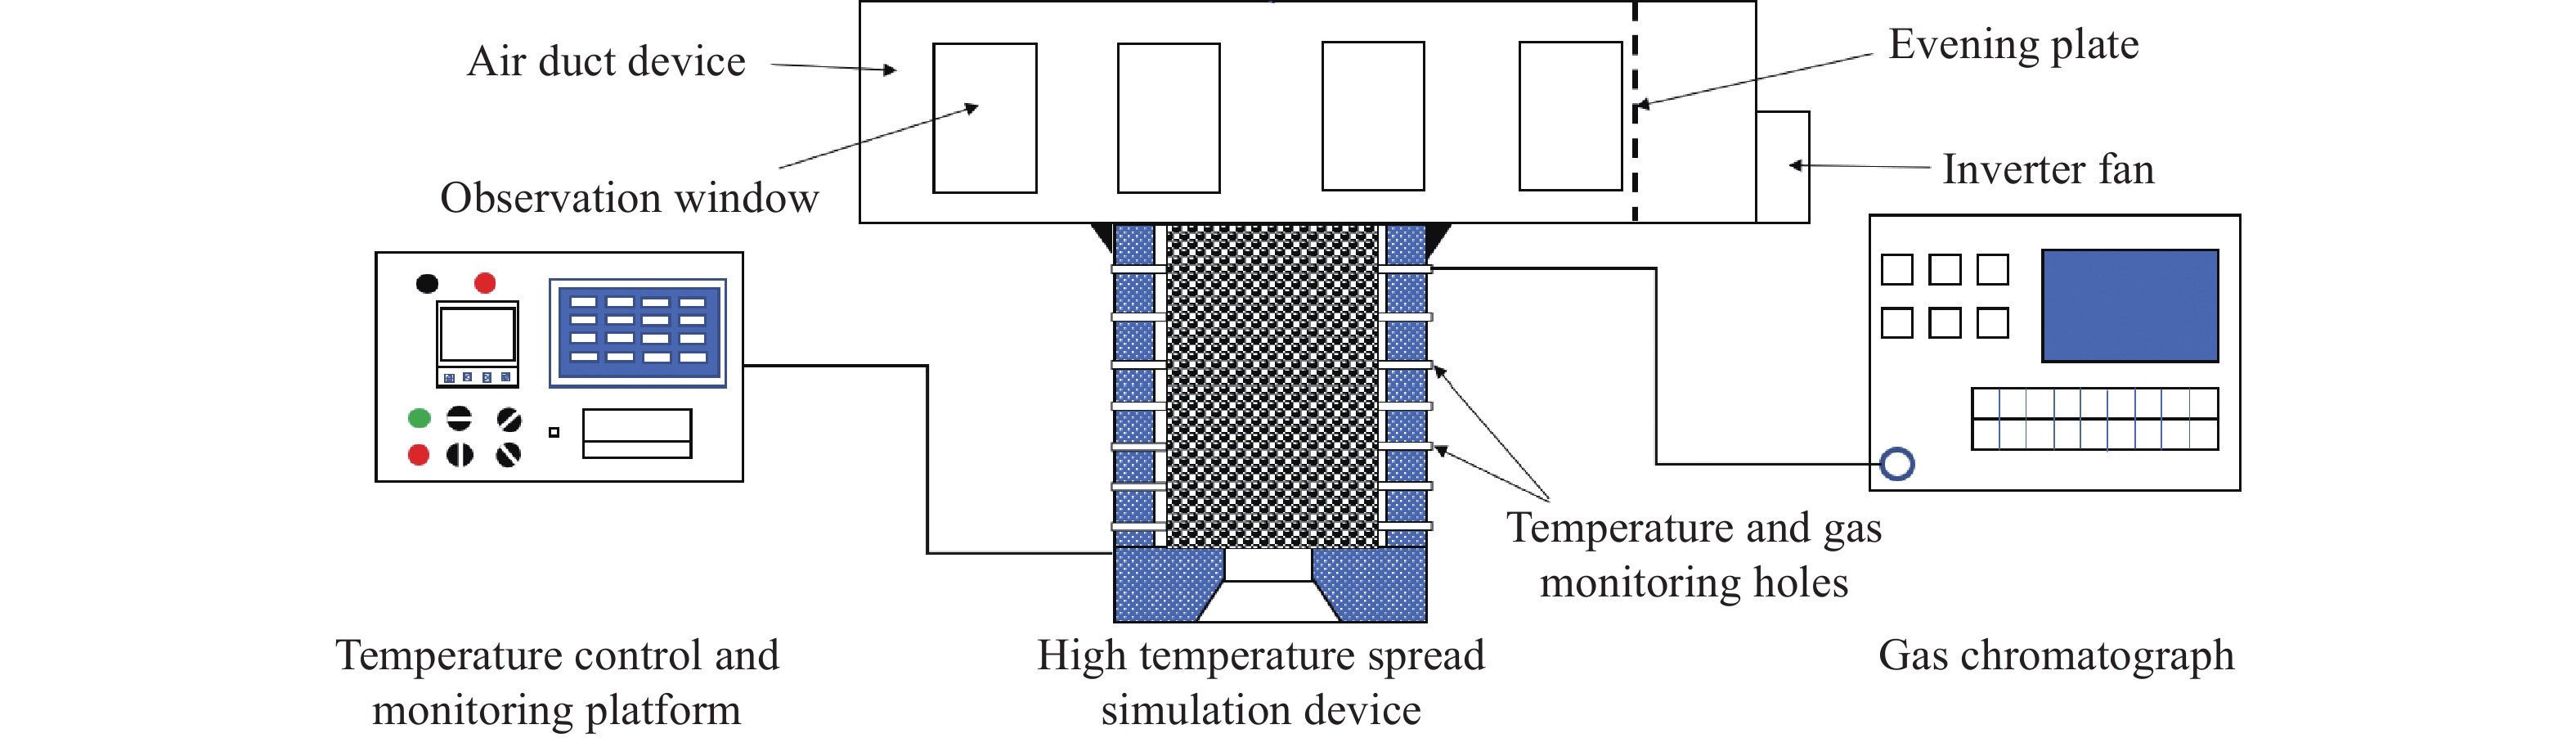
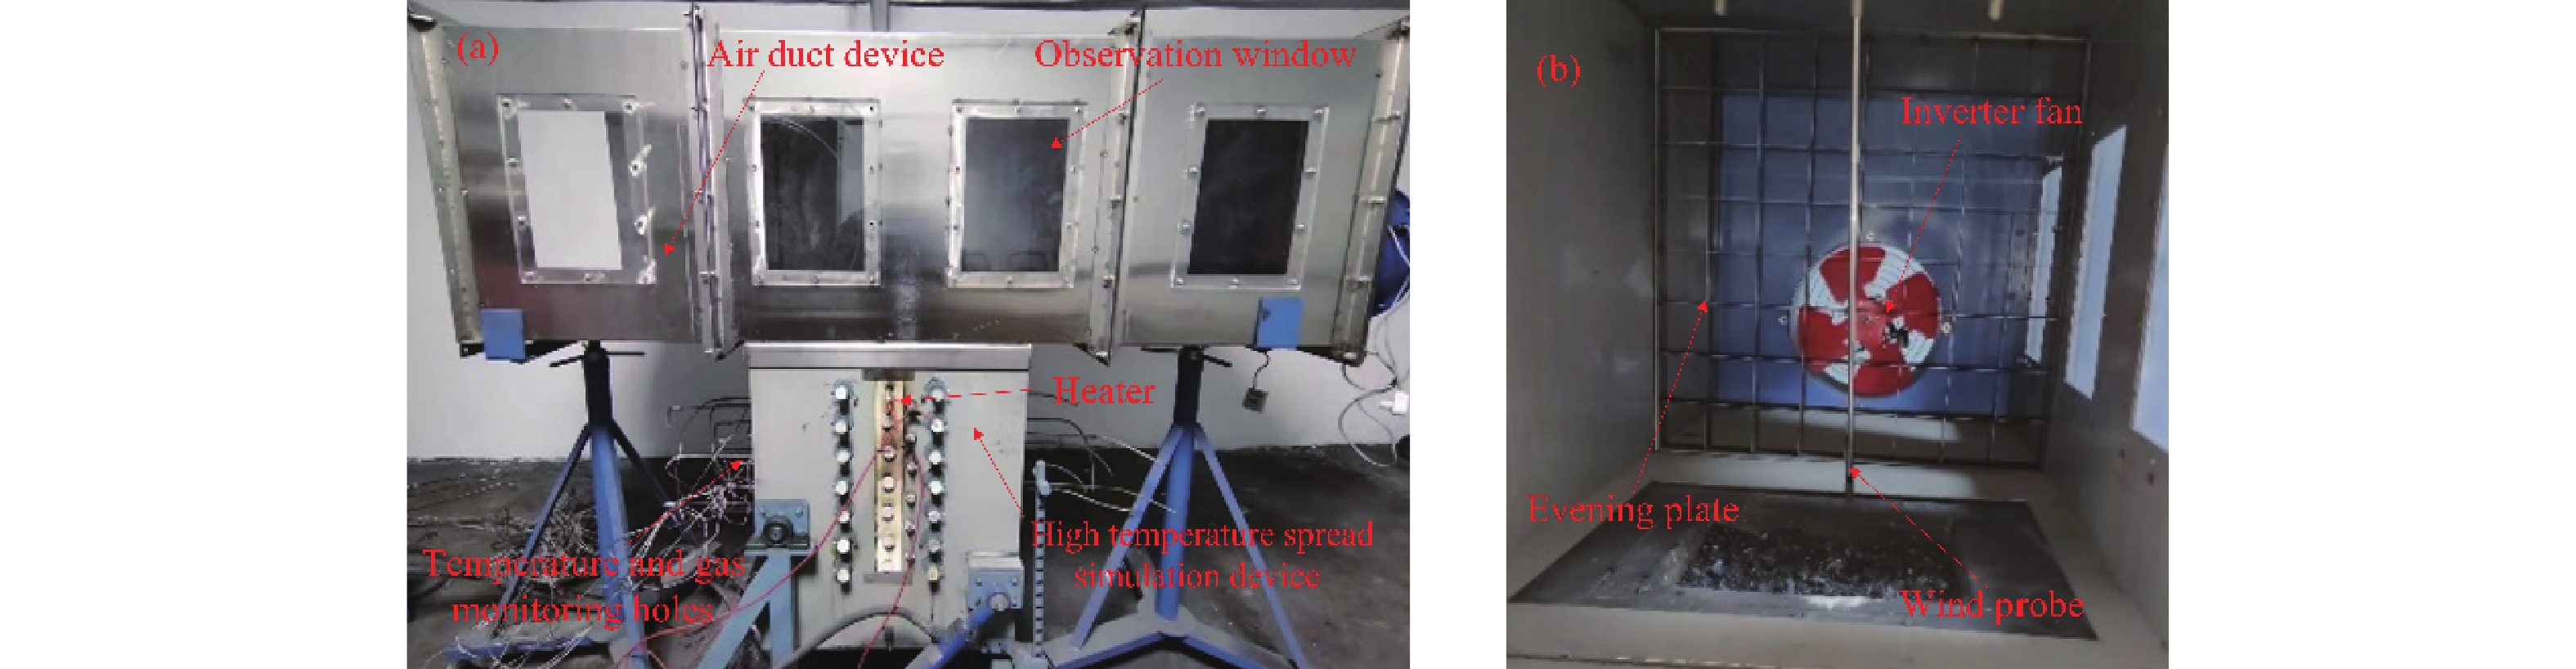
自行搭建的煤自燃敞车载运相似模拟实验装置如图2所示. 实验装置主要由温度控制与监测平台、高温蔓延模拟装置、可调节风筒装置和气相色谱仪4部分组成. 实验炉体内部尺寸为: 0.3 m×0.3 m×0.6 m. 炉体外由耐火砖和纤维的混合结构组成保温层,保证炉体内温度均匀控制在±10 ℃内. 炉体四周均匀布置有直径16 mm的通孔,用于温度和气体数据采集(如图3(a)). 风筒尺寸为: 1.8 m×0.62 m×0.62 m,风筒末端连接有直径为0.31 m的SF型永磁变频风机,转速调节范围500~2800 r·min−1. 为了确保风机产生的风流稳定流过松散煤体表面,在距风筒末端0.5 m处安设有均流板,均流板与风筒紧密镶嵌,起到均匀风流的作用(如图3(b)),通过风速测量仪测量炉体表面预留的前、中、后测点的点风速,并计算测点以及两交叉线上测点风速的平均值,误差范围控制在±0.01 m·s−1,因此可以认为均匀风流流过煤体表面. 本文中风流的风速是在静止的空气中经过煤体表面的表观风速.
![]() 图 2 煤自燃敞车载运系统图Figure 2. Coal spontaneous combustion gondola transportation system diagram
图 2 煤自燃敞车载运系统图Figure 2. Coal spontaneous combustion gondola transportation system diagram![]() 图 3 煤自燃敞车载运实验装置图. (a)敞车载运实验模型; (b)风筒内部结构图Figure 3. Coal spontaneous combustion gondola transportation experimental device diagram: (a) gondola transport experimental model; (b) internal structure of the blower
图 3 煤自燃敞车载运实验装置图. (a)敞车载运实验模型; (b)风筒内部结构图Figure 3. Coal spontaneous combustion gondola transportation experimental device diagram: (a) gondola transport experimental model; (b) internal structure of the blower实验过程中,通过温度监测系统实时掌握炉体内部温度变化规律,该检测系统测温间隔5 min,温度精度±0.1 ℃. 实验风流条件如表3所示.
表 3 实验风流条件Table 3. Experimental wind conditionsExperiment number Wind size /(m·s−1) Fan speed /(r·min−1) 1 0 0 2 1 800 3 2 1000 (1)模型相似性条件的满足.
受实验条件限制,原型实验无法在实际中进行,因此就要求所搭建的相似模拟试验台尽可能接近原型试验. 因此,基于流体力学中的相似准则搭建相似模型来进行试验.
1)几何相似:几何相似是指原型与模型的长度之间存在一定的比值关系.
$$ {C}_{l}=\frac{{l}_{\mathrm{p}}}{{l}_{\mathrm{m}}} $$ (1) 式中:
$ {C}_{l} $ 为几何相似常数;$ {l}_{\mathrm{p}} $ 为原型某一部位长度,m;$ {l}_{\mathrm{m}} $ 为模型对应部位长度,m.2)时间相似:模型在实验过程中,可以与实际情况一致,也可以加快或者缓慢,但要求模型与原型在同一点上的变化过程是在同一时间的比例进行.
$$ {C}_{t}=\frac{{t}_{\mathrm{p}}}{{t}_{\mathrm{m}}} $$ (2) 式中:
$ {C}_{t} $ 为时间相似常数;$ {t}_{\mathrm{p}} $ 为原型某点变化所需时间,h;$ {t}_{\mathrm{m}} $ 为模型对应点变化所需时间,h.3)运动相似:模型各部分结构的相应点与原型在各个方向上一致,并且在相应时刻具有一定比例关系,运动之间的相似性表示为:
$$ {C}_{v}=\frac{{v}_{\mathrm{p}}}{{v}_{\mathrm{m}}} $$ (3) $$ {C}_{a}=\frac{{a}_{\mathrm{p}}}{{a}_{\mathrm{m}}} $$ (4) 式中:
$ {C}_{v} $ 为速度相似常数;$ {C}_{a} $ 为加速度相似常数;$ {v}_{\mathrm{p}} $ 为原型某点的速度,m·s−1;$ {v}_{\mathrm{m}} $ 为模型对应点的速度,m·s−1;$ {a}_{\mathrm{p}} $ 为原型某点的加速度,m·s−2;$ {a}_{\mathrm{m}} $ 为模型对应点的加速度,m·s−2.4)动力相似:模型各部分和原型对应点上的力在各个方向上一致,比例相等.
$$ {C}_{F}=\frac{{F}_{\mathrm{p}}}{{F}_{\mathrm{m}}} $$ (5) 式中:
$ {C}_{F} $ 为动力相似常数;$ {F}_{\mathrm{p}} $ 为原型某点上的作用力,N;$ {F}_{\mathrm{m}} $ 为模型对应点上的作用力,N.在研究敞车运输的过程中,可将空气流态视为不可压缩流体,而在描述不可压缩流体时需满足Navier–Stokes运动方程. 依据模型与原型之间的相似比,Navier–Stokes运动方程应同时满足下式:
$$ \left\{\begin{aligned} &\frac{{C}_{v}}{{C}_{t}}\cdot \frac{{\partial v}_{z}}{\partial t}+\frac{{C}_{v}^{2}}{{C}_{l}}\left({v}_{x}\frac{{\partial v}_{x}}{\partial x}+{v}_{y}\frac{{\partial v}_{y}}{\partial y}+{v}_{z}\frac{{\partial v}_{z}}{\partial z}\right)=\\ &\qquad{C}_{g}g-\frac{{C}_{p}}{{C}_{P}{C}_{l}}\cdot \frac{1}{\rho }\cdot \frac{\partial p}{\partial x}+\frac{{C}_{v}{C}_{\mu }}{{C}_{p}{C}_{l}^{2}}\left(\nu \cdot {\nabla }^{2}{v}_{z}\right)\\ &\frac{{C}_{v}}{{C}_{l}}\cdot \left(\frac{{\partial v}_{x}}{\partial x}+\frac{{\partial v}_{y}}{\partial y}+\frac{{\partial v}_{z}}{\partial z}\right)=0\end{aligned}\right. $$ (6) 式中:
$ {C}_{g} $ 为重力加速度相似常数;$ {C}_{\mu } $ 为动力黏度系数相似常数;p为压力,Pa;ρ为密度,g·cm−3;g为重力加速度,m·s−2;vx、vy、vz为流体在t时刻,在点(x,y,z)处的速度分量,m·s−1;υ为运动黏性系数,m2·s−1;$ \mu $ 为流体的动力黏度系数,Pa·s.当模型满足式(6)时,可以得到下列与流体运动相关的相似准则:
5)欧拉准则:
$$ Eu=\frac{\Delta p}{{\rho v}^{2}} $$ (7) 式中:
$ Eu $ 为欧拉数,表示压力差与惯性力之间的比值关系,反应压强对流体流动的影响,原型气流和模型气流压力和惯性力的相似关系可以写为:$ {Eu}_{\mathrm{p}}= {Eu}_{\mathrm{m}} $ .$ \Delta p $ 为流体表面的压力差;v为流速,m·s−1.6)斯德鲁哈准则:
$$ Sh=\frac{l}{vt} $$ (8) 式中:Sh为斯德鲁哈数,适用于非稳态流动,反应流体流态为恒定流或非恒定流,模型气流和原型气流的相似关系可写为:
$ {Sh}_{\mathrm{p}}={Sh}_{\mathrm{m}} $ ,l为特征长度,m.7)弗诺德准则:
$$ Fr=\frac{{v}^{2}}{gl} $$ (9) 式中:
$ Fr $ 为弗诺德数,是惯性力和重力的相对比值,反应重力对流体流动的影响,模型气流和原型气流惯性力和重力的相似关系可写为:$ {Fr}_{\mathrm{p}}={Fr}_{\mathrm{m}} $ .8)雷诺准则:
$$ Re=\frac{\rho vl}{\mu } $$ (10) 式中:
$ Re $ 为雷诺数,是惯性力和黏性力的相对比值,反应摩擦力对流体流动的影响,模型气流和原型气流惯性力和黏性力的相似关系可写为:$ {Re}_{\mathrm{p}}= {Re}_{\mathrm{m}} $ .实验过程中,模型与原型的流体介质均为空气,并且所处温差较小,因此可认为流体的密度和黏性系数不变. 在我国敞车载煤火车原型的尺寸普遍为:12 m×3 m×2.1 m. 以原型火车车箱宽3 m为相似基准,火车在行驶方向上表面煤样所受风流大小基本一致,即车箱长度对表面煤样受风流影响较小,所以可以将车箱在长度方向上划分为4个尺寸大小为: 3 m×3 m的等体积区域进行研究;本文中主要考虑高温向下蔓延过程中表面横向风流对其的影响,而风流会带走松散煤体内部产生的热量. 因此,实验装置要满足一定的深度,使得煤体内部产生热量可以积聚,并且向下蔓延. 考虑实验结果的精确性,设定模型的高度为0.6 m,原型与模型之间的长宽比尺为10∶1,通过Navier–Stokes运动方程,确定原型与模型之间的速度相似比应满足3.16∶1. 本次实验考虑敞车载运在低行进速度下的风速,并以无风条件下的实验作为对比.
(2)测点布置.
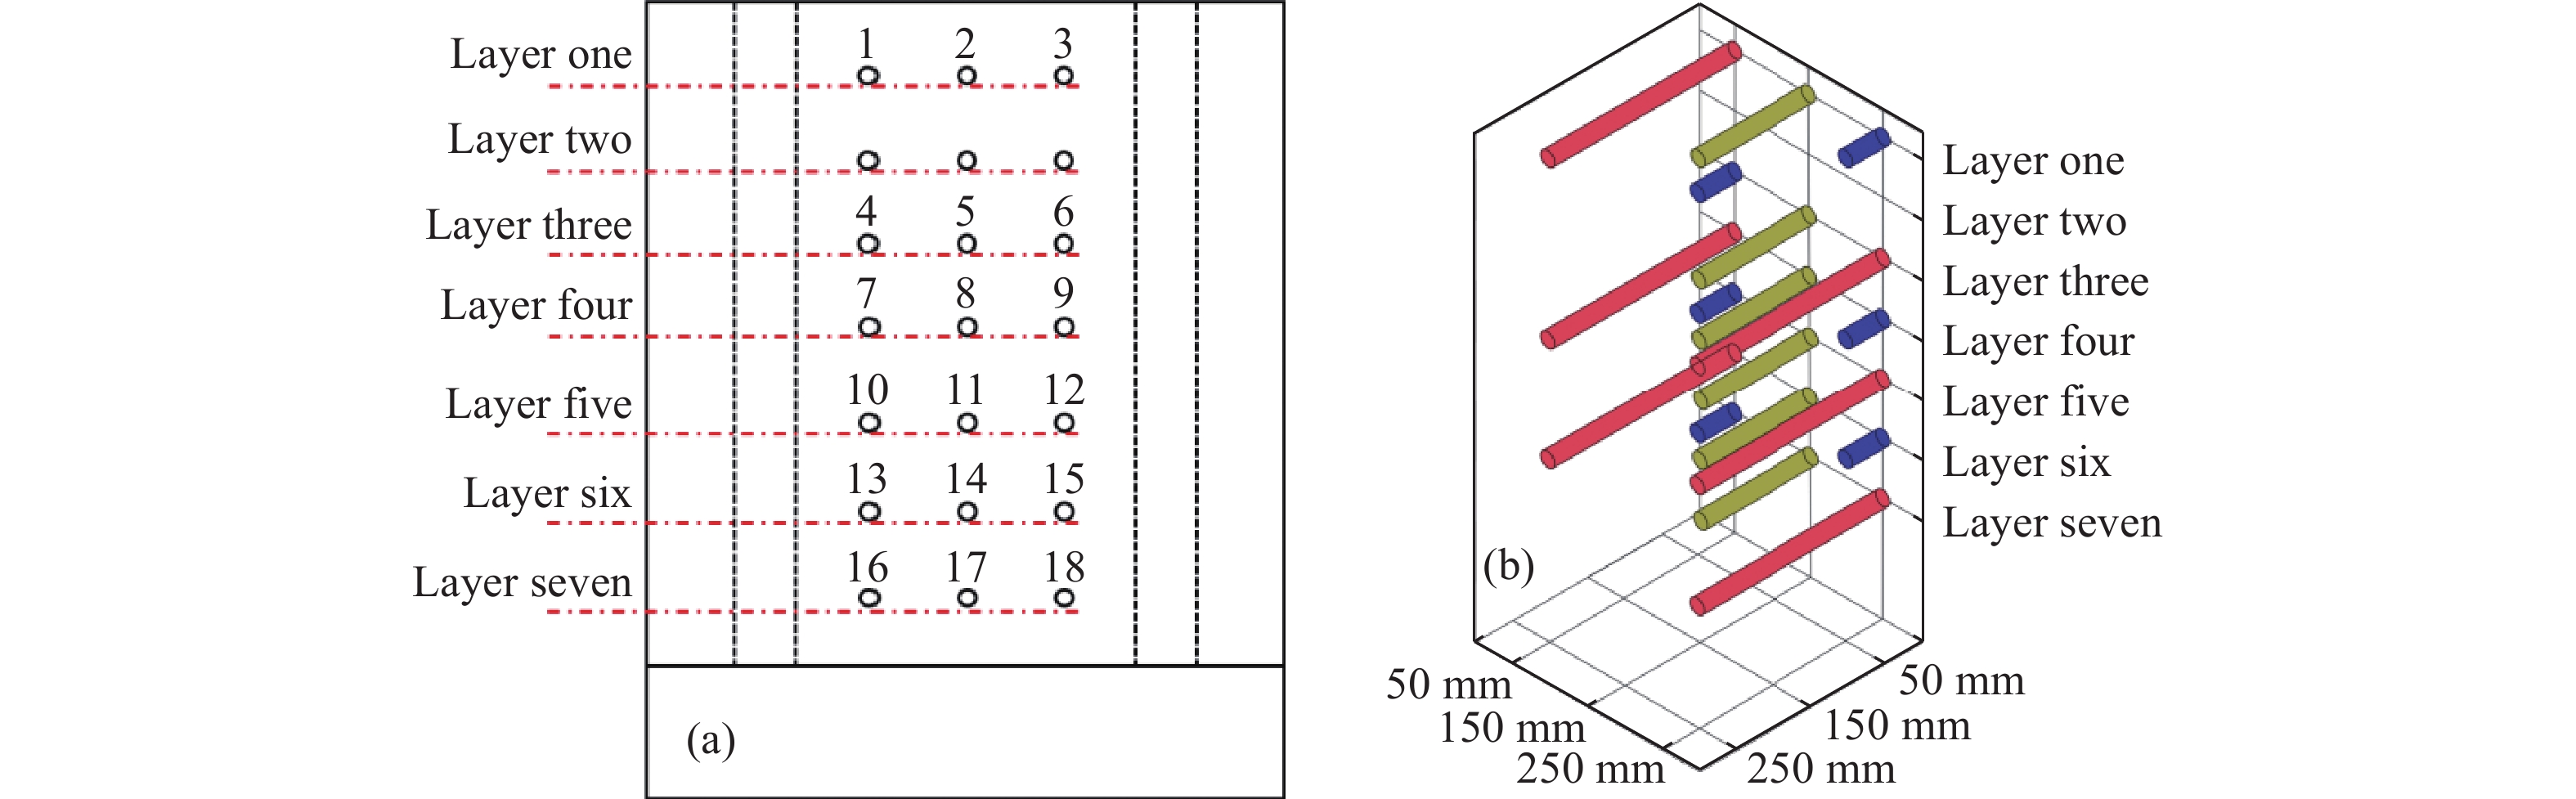
通过实验炉体左侧通孔水平插入热电偶与取气管路,每个测点同时兼备测温和取气的功能,测点编号分布如图4(a)所示. 每层共布置三个测点,插入炉体的距离分别为50、150和250 mm,共布置6层,总计18个测点,每层测点深度及插入炉体内的距离如图4(b)和表4所示. 炉体内每层测点插入的深度各不相同,在空间上交替分布,使得炉体内部测点网格化,达到均匀监测炉体内煤样不同位置的温度与气体变化.
![]() 图 4 炉体测点分布图. (a)测点外侧编号图; (b)测点内部位置图Figure 4. Distribution map of measuring points on the left side of the furnace body: (a) outside number of measuring points; (b) internal position of the measuring point表 4 测点深度及插入炉体内的距离Table 4. Depth of measuring point and distance inserted into the furnace
图 4 炉体测点分布图. (a)测点外侧编号图; (b)测点内部位置图Figure 4. Distribution map of measuring points on the left side of the furnace body: (a) outside number of measuring points; (b) internal position of the measuring point表 4 测点深度及插入炉体内的距离Table 4. Depth of measuring point and distance inserted into the furnaceLayers Depth/mm Measuring point
numberDistance /mm Measuring point
numberDistance /mm Measuring point
numberDistance /mm Layer one 30 1# 50 2# 150 3# 250 Layer three 170 4# 250 5# 150 6# 50 Layer four 240 7# 50 8# 150 9# 250 Layer five 310 10# 250 11# 150 12# 50 Layer six 380 13# 50 14# 150 15# 250 Layer seven 450 16# 250 17# 150 18# 50 (3)加热棒位置.
前期研究发现,煤自燃升温过程中最小浮煤厚度随煤温的升高呈现先增高后降低的变化趋势,当最小浮煤厚度超过10 cm时,煤体有较好的储热条件,煤的氧化反应可以持续进行[16−17]. 因此,本文在炉体第二层中部通孔插入加热棒,第二层通孔距离炉体表面的距离为12 cm,保证煤氧反应可以持续进行.
(4)初始加热温度和高温区域确定.
(a) 初始加热温度.
煤自燃过程可划分为自热段、自燃段和燃烧段. 在自热段时,煤体温度发生第一次突变,即临界温度;在自燃段时,煤体温度发生第二次突变,即干裂温度. 在煤氧反应达到临界温度之前,煤体升温较慢,对氧气的消耗较低,主要发生吸热反应,放热量较少,因此没有适宜的条件或者稳定的热源,煤自然发火不易实现[18]. 然而,当煤氧反应达到干裂温度时,反应速率加快,放热明显增强,并伴随产生大量的热,此时,煤与氧气的反应可以自发进行[19−20]. 因此,确定实验恒温温度为煤样的干裂温度. 本论文中实验煤样自燃的干裂温度将通过程序升温实验确定.
(b) 高温区域定义.
着火温度是煤在空气中开始并继续燃烧的最低温度,前期研究发现,当恒温区域的温度超过煤样的着火温度时,煤样开始燃烧,产生大量CO、CO2等气体,放出大量的热[21−22]. 此时不需要向炉体内煤样提供热源,煤样的高温反应仍能持续下去,煤样的着火温度范围普遍为280 ~ 340 ℃[23−24]. 本文选用300 ℃作为炉体内煤样的高温区域. 实验过程中,加热棒相邻上层或下层某测点温度达到300 ℃时,表明高温区域已经形成,停止加热.
(5)实验过程.
以风流1 m·s−1实验为例,将制备的煤样装入炉体中,调节风筒装置高度,确保风筒与炉体紧密连接. 打开风机开关,设置风机转速待通过煤体表面的风流稳定时,开始对炉体第二层进行恒温,设置恒温温度为实验煤样的干裂温度,当实验进行到2.7 h时,检测到5#测点最先达到300 ℃,此时取出加热棒,停止加热. 实验过程中伴随有大量烟气产生,但没有明火. 当监测到炉体第七层温度在较长时间内不在发生变化,说明炉体底部已经形成稳定的高温区域,则本组实验结束.
2. 结果与讨论
2.1 特征温度
通过煤自燃程序升温实验,结合煤氧化过程中气体浓度随温度的变化规律,采用指标气体增长率分析法计算出煤自燃过程特征温度[25]. 计算公式如下:
$$ B=({c}_{i+1}-{c}_{i})/\left({t}_{i+1}-{t}_{i}\right) $$ (11) $$ Z=B/{c}_{i} $$ (12) 其中:B为温度每升高1 ℃的气体浓度变化率;
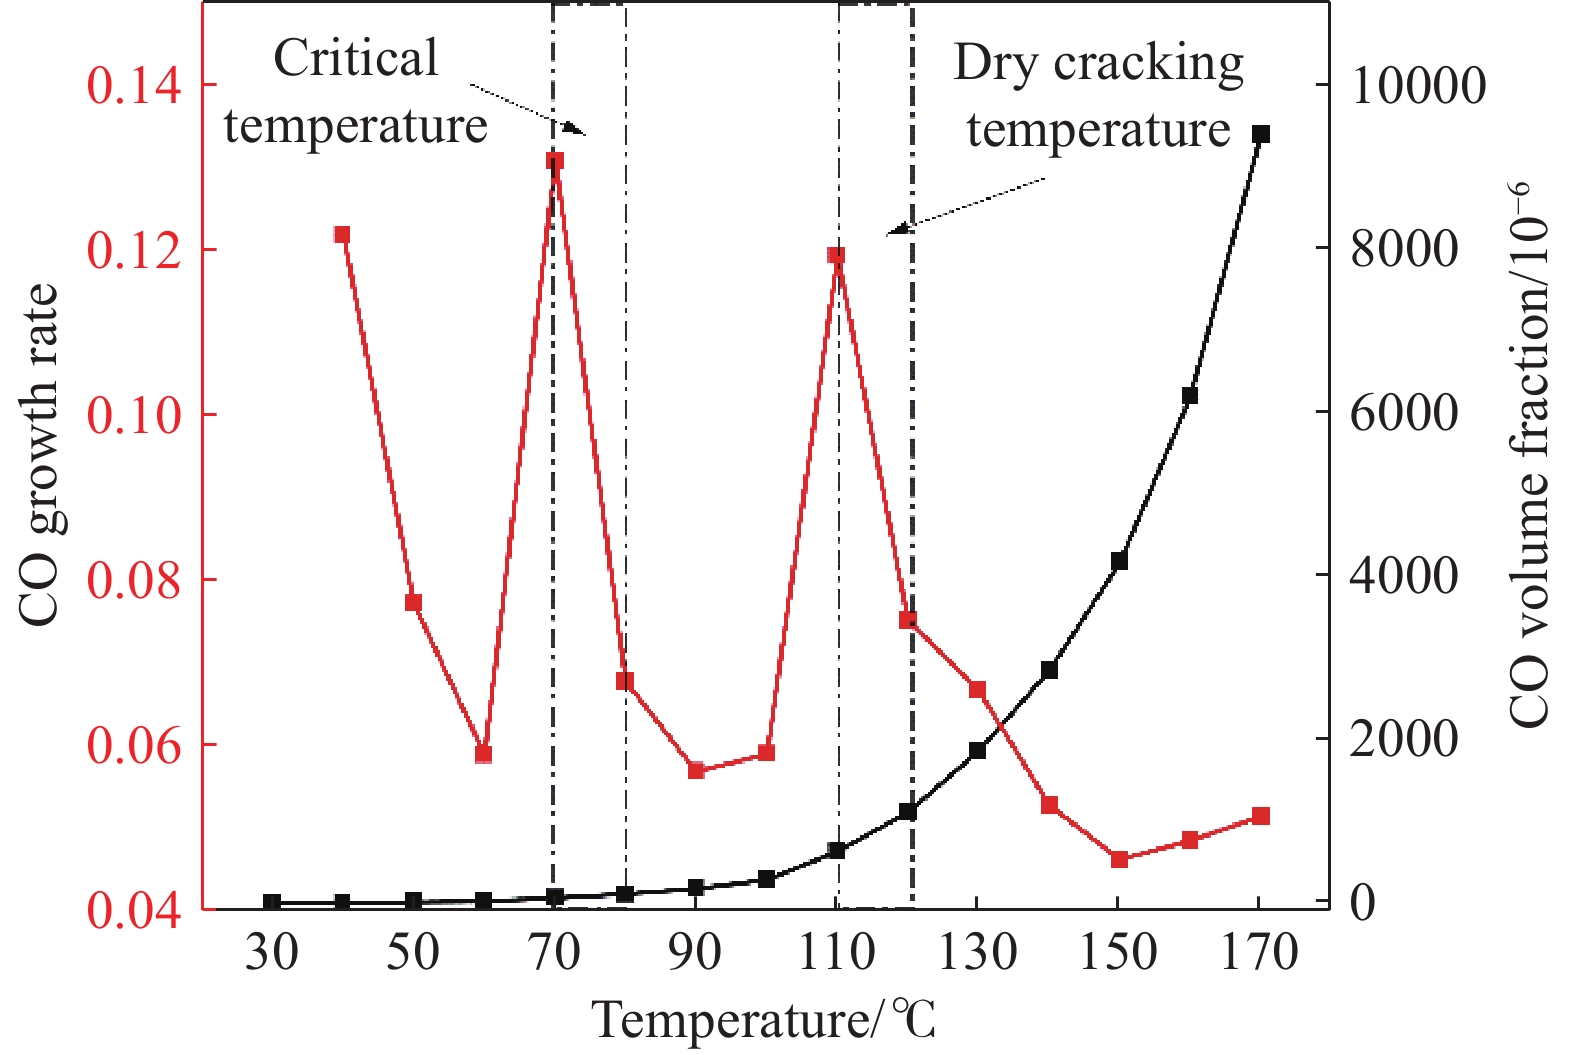
$ {c}_{i} $ 、$ {c}_{i+1} $ 为两相隔时刻的气体体积分数;$ {t}_{i} $ 、$ {t}_{i+1} $ 为两相隔时刻的温度;Z为温度每升高1 ℃的气体浓度的增长率.图5为CO浓度以及CO气体增长率随温度变化曲线图. 可以看出,随着温度的升高,CO气体浓度呈指数型增长规律,在低温阶段,CO气体浓度缓慢增长,当煤温达到临界温度与干裂温度时,CO气体增长率出现极大值. 同时,确定煤样自燃的临界温度为70 ~ 80 ℃,干裂温度为110 ~ 120 ℃.
![]() 图 5 CO体积分数及其气体增长率与温度变化曲线Figure 5. CO concentration and growth rate curve with temperature
图 5 CO体积分数及其气体增长率与温度变化曲线Figure 5. CO concentration and growth rate curve with temperature2.2 风流对煤体温度分布的影响
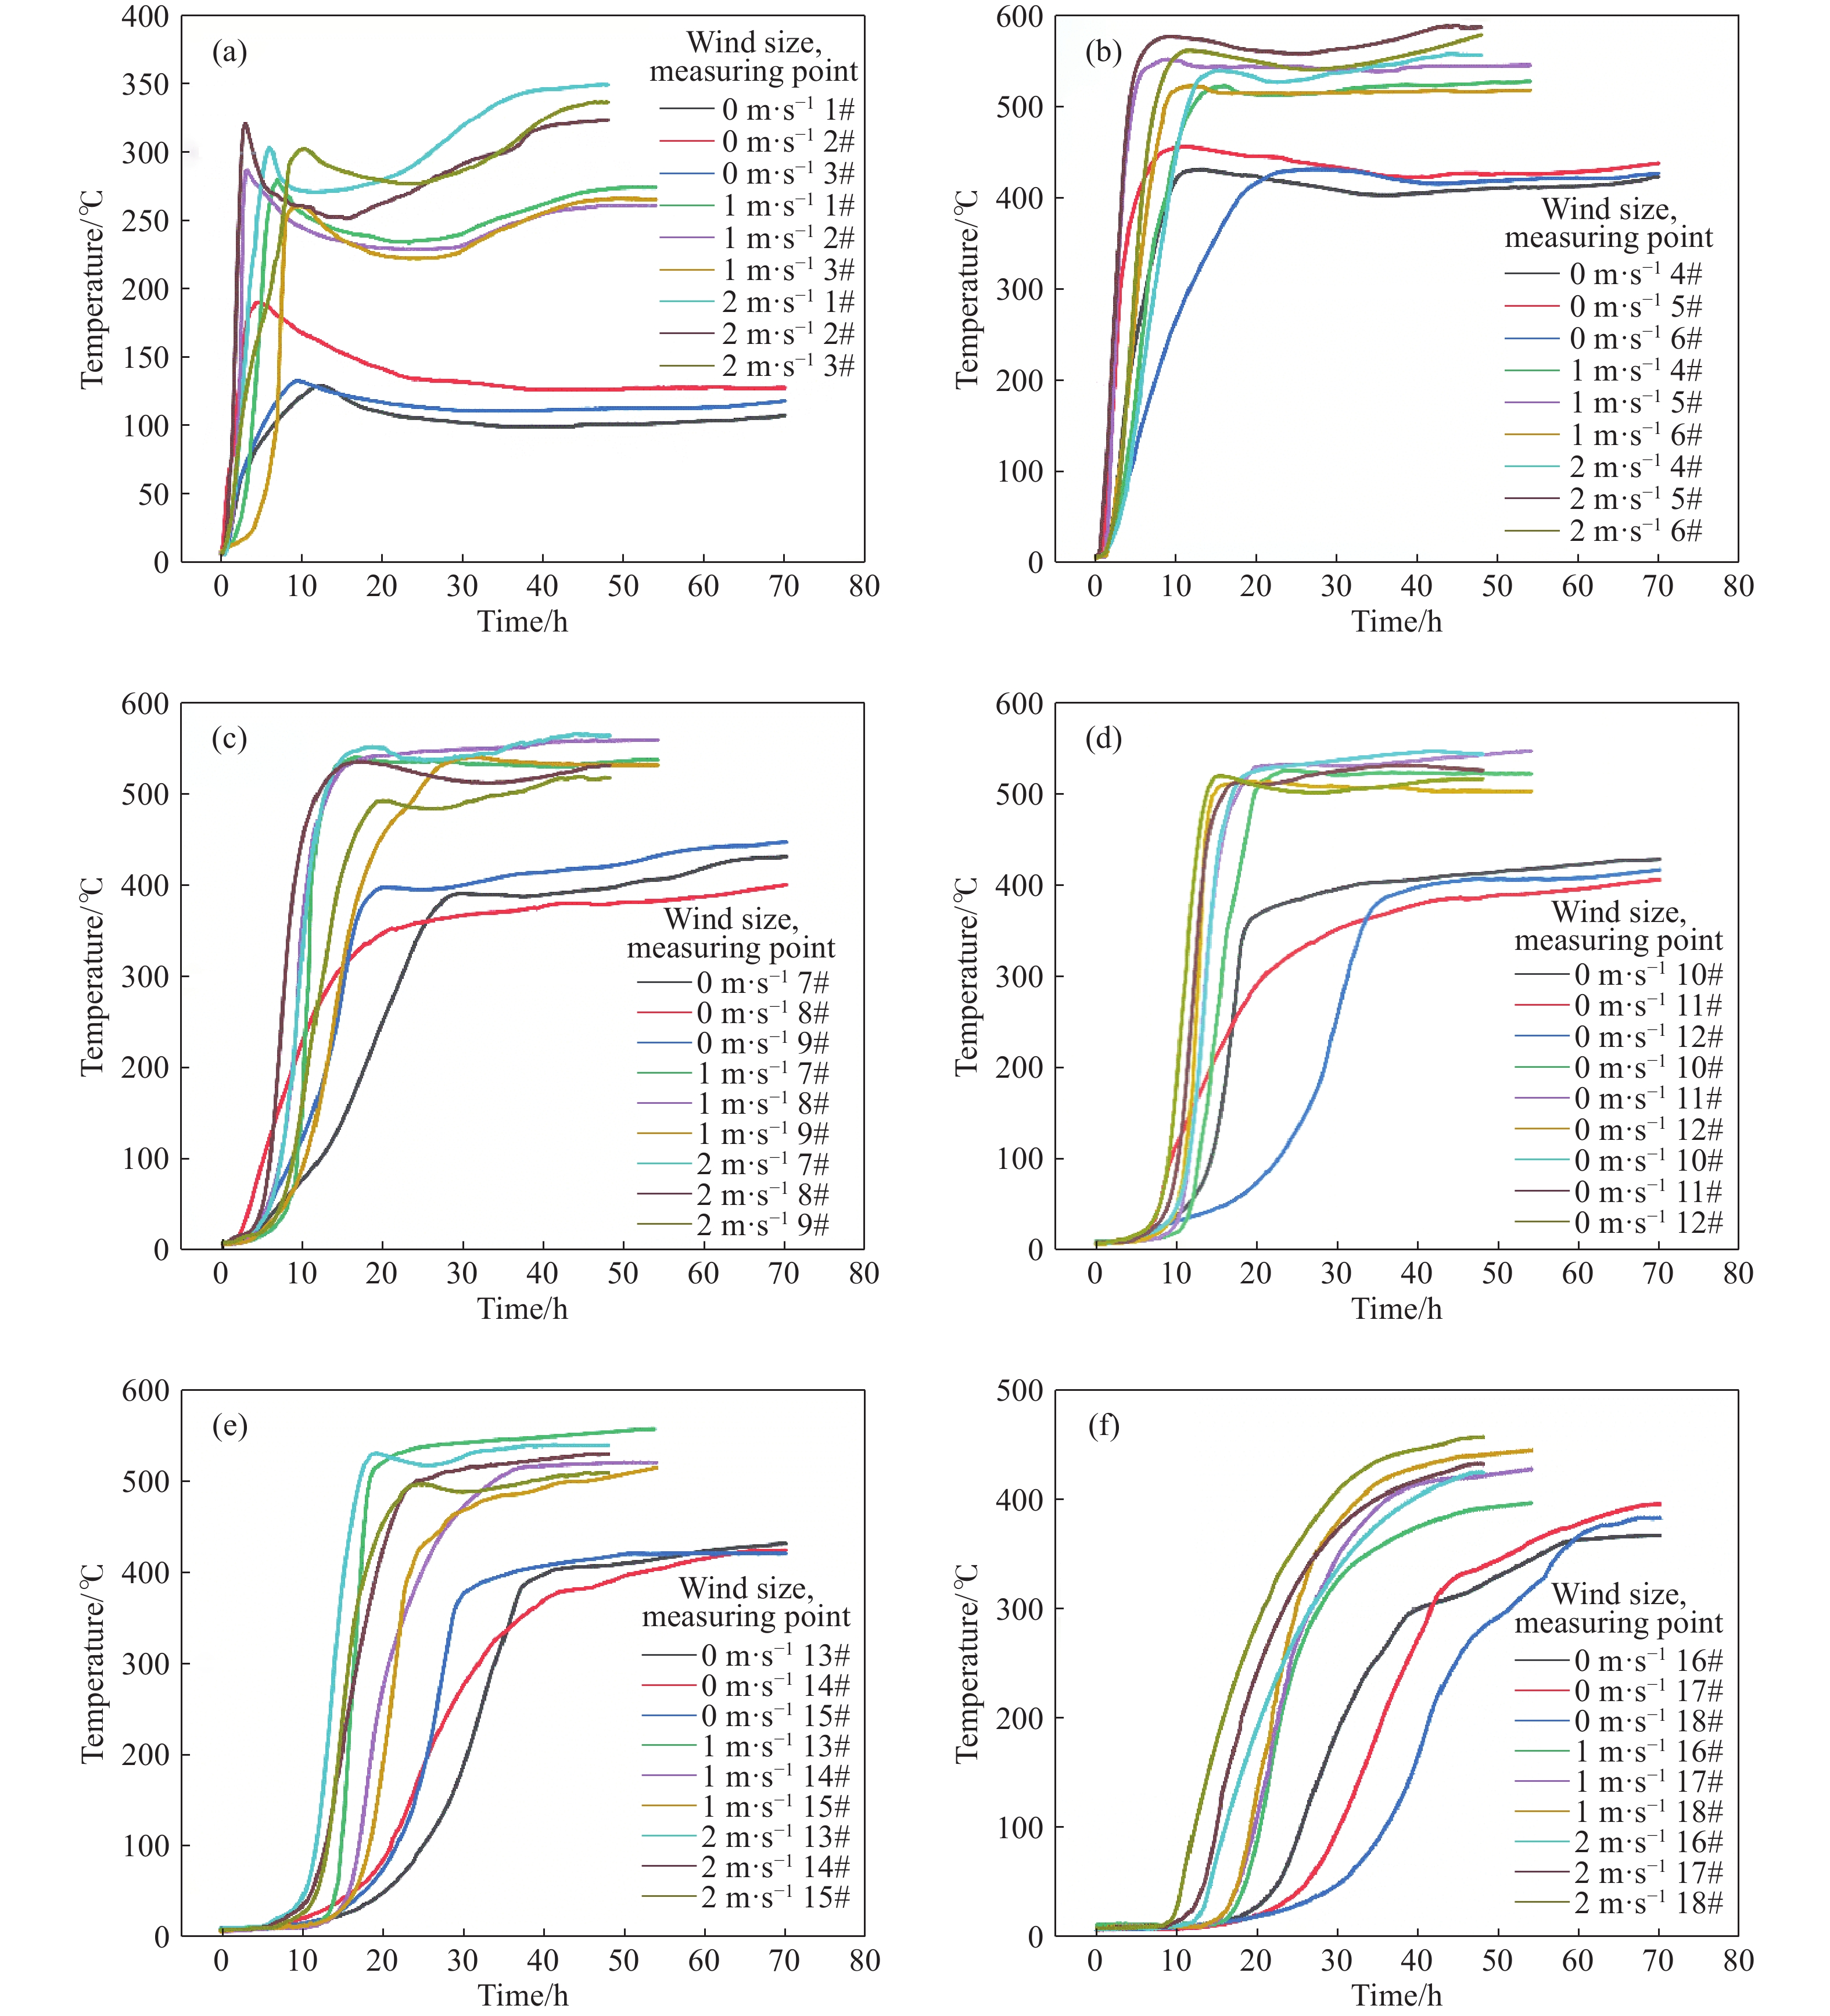
各测点温度随时间变化曲线如图6所示. 实验初始阶段,各测点温度与环境温度接近,温度差±5 ℃. 随着恒温时间的增加,各测点温度开始发生变化,距离热源较近的测点温度上升明显,而距离热源较远的测点温度变化相对缓慢. 在风流为0、1和2 m·s−1时,实验分别经历70、54和48 h结束,即在风流作用下高温纵深蔓延速度明显加快.
![]() 图 6 测点温度随时间变化曲线. (a) 第一层测点; (b) 第三层测点; (c) 第四层测点; (d) 第五层测点; (e) 第六层测点; (f) 第七层测点Figure 6. Temperature curves with time of the measurement points: (a) layer one; (b) layer three; (c) layer four; (d) layer five; (e) layer six; (f) layer seven
图 6 测点温度随时间变化曲线. (a) 第一层测点; (b) 第三层测点; (c) 第四层测点; (d) 第五层测点; (e) 第六层测点; (f) 第七层测点Figure 6. Temperature curves with time of the measurement points: (a) layer one; (b) layer three; (c) layer four; (d) layer five; (e) layer six; (f) layer seven图6为测点温度随时间变化曲线图. 图6(a)为不同风流下第一层测点温度变化曲线图. 在风流0 m·s−1时,各测点温度快速升高再缓慢降低,最后趋于稳定,温度维持为125±10 ℃. 实验过程中处于中间位置的2 #测点温度最先发生变化,且温度明显高于同层其他两个测点. 在风流为1 m·s−1和2 m·s−1时,第一层测点温度表现出相同的变化趋势. 即温度迅速升高到峰值温度后开始缓慢降低,随着实验进行,温度又逐渐上升最后趋于稳定,最终温度分别维持在260±5 ℃和340±10 ℃. 这与煤的热扩散率有关. 随着温度升高,热扩散率先降低后升高[26]. 对比风流0与1、2 m·s−1温度曲线发现,风流明显提高了各测点的峰值温度. 对于第一层测点,风流越大,表面漏风越严重,一方面表面风流会带走煤氧反应产生的热量[27−28],另一方面,风流为煤氧反应提供充足的氧气,加速氧化反应进行,当散热小于煤氧反应产生的热量时,煤体温度将会上升[29]. 因此,对于表层测点,风流对燃烧有促进作用.
不同风流下第三层测点温度变化曲线如图6(b)所示,在不同风流作用下,各测点温度迅速升高达到峰值温度后趋于稳定. 实验初始阶段,分别在3、2.6和2.5 h观察到风流为0、1和2 m·s−1时的5#最先达到300 ℃,且高温区域最终稳定在420±10、520±10和570±10 ℃. 实验进行到10 h后,各5#形成的高温区域基本稳定. 由于5#距离加热棒最近,因此5#达到拐点的温度对实验最终的温度影响较大;5#温度越高,第三层所形成的高温区域最大值温度也就越高,从而决定了高温向下蔓延的速度与煤体形成高温区域范围.
随着反应持续进行,第四层测点温度随时间变化如图6(c). 在不同风流作用下,各测点温度变化表现出与第三层测点温度变化相似的规律,即随着反应持续进行,第四层各测点温度迅速升高到峰值温度后趋于稳定. 在风流为0、1和2 m·s−1时,分别在14、9.5和7.7 h观察到8#温度达到300 ℃,最终高温区域稳定在400±10、530±5和520±10 ℃. 与同一层其他两测点相比,燃烧蔓延受5#高温区域影响较大. 与风流0 m·s−1时相比,风流1 m·s−1和2 m·s−1时8#达到300 ℃的时间提前了4.5 h和6.3 h.
实验进行到7 h时,第五层测点开始升温(如图6(d)). 在风流0 m·s−1时,各测点温度变化表现出不同的变化趋势. 11#测点在实验进行到7 h时,温度迅速升高,而10#和12#温度先缓慢升高再快速升高,在17.5 h观察到10#温度达到300 ℃. 最终3个测点温度维持在420±10 ℃. 对于风流1 m·s−1和2 m·s−1时,各测点温度变化趋势一致,分别在12.7 h和11.2 h观察到12#温度达到300 ℃,最终温度稳定在510±10 ℃.
当温度蔓延到第六层时(如图(e)),风流对高温区域蔓延产生明显促进作用. 在风流0、1、2 m·s−1时,分别在15、10、7 h观察到第六层各测点温度发生变化,推测更大的表面风流可以为炉体下部煤氧反应提供更充足的氧气,使反应更剧烈,从而放出更多热量. 随着反应持续进行,风流0 m·s−1时,在27.5 h观察到15#温度最先达到300 ℃,且温度最终稳定在420 ℃. 在风流1 m·s−1和2 m·s−1时,在实验进行到16.5 h和14 h时,观察到高温区域均出现在13#位置,且温度最终稳定在520±10 ℃.
第七层测点温度随时间变化曲线如图6(f)所示. 风流0 m·s−1时,在20 h时观察到各测点温度开始升高,在40 h时观察到16#最先达到300 ℃,在70 h后各测点温度趋于稳定. 风流1 m·s−1时,在15 h观察到各测点温度开始升高,25 h时18#最先达到300 ℃,54 h后各测点温度趋于稳定. 风流2 m·s−1时,在10 h时观察到各测点温度开始升高,21 h时18#最先达到300 ℃,48 h后各测点温度趋于稳定. 与风流0 m·s−1相比,风流1 m·s−1、2 m·s−1的实验高温蔓延时间分别提前了0.3 倍和0.5 倍,且形成的高温区域温度升高了120±20 ℃,高温区域最终稳定在510~560 ℃.
2.3 高温区域蔓延规律
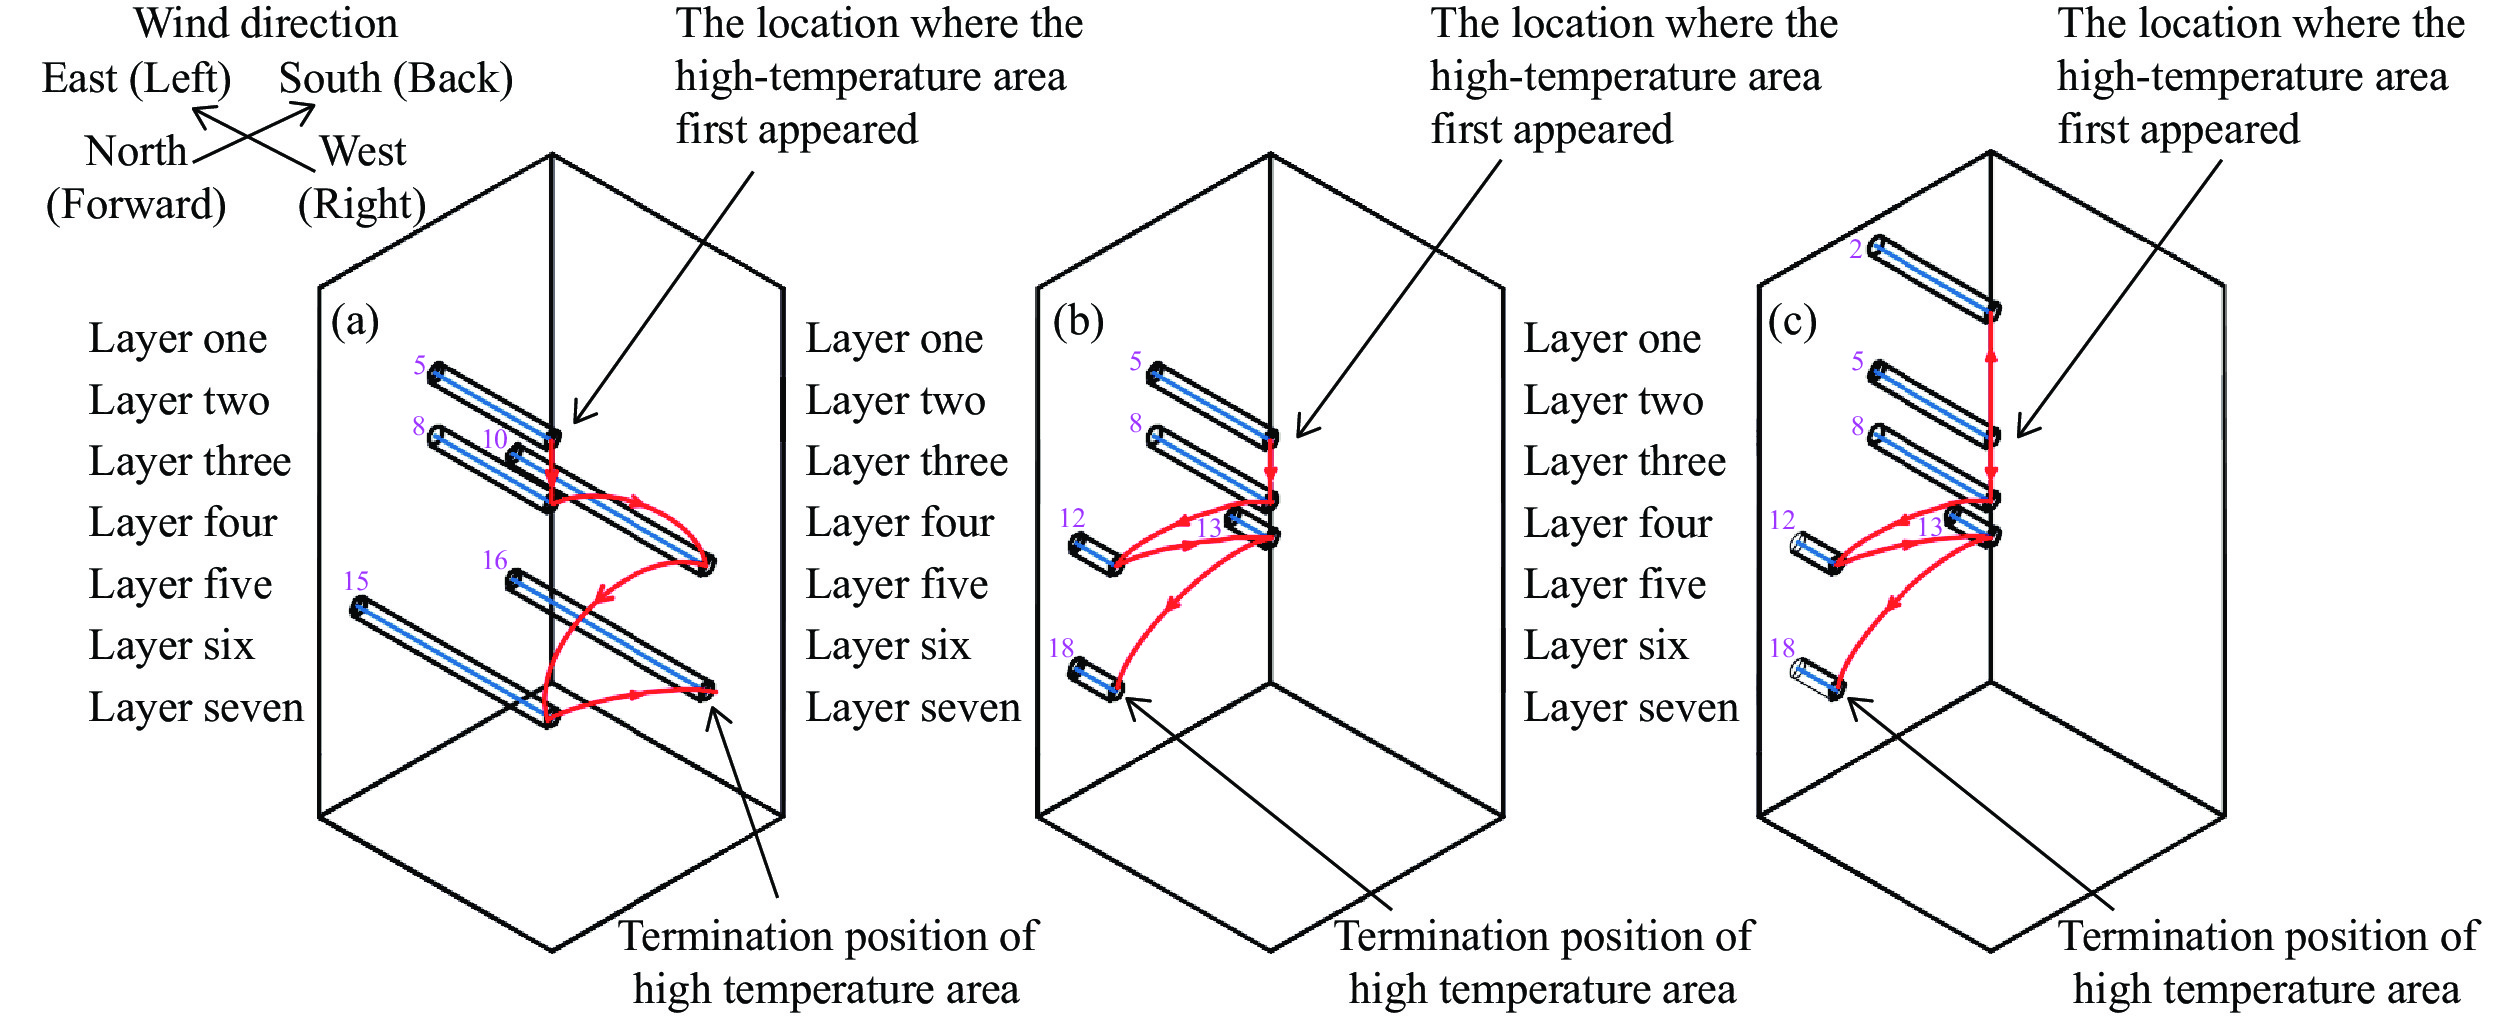
充足的氧气是煤氧反应能够持续发生的重要前提. 松散煤体属于非均匀多孔介质,各部位的传热是辐射、对流和传导共存的综合传热过程,属于不稳定传热[30]. 随着时间推移,热源不断向深部蔓延,由于受到物理吸附的作用和裂隙影响,氧气首先沿着裂隙通道扩散,因此导致裂隙带煤样更容易发生自燃[31]. 由图7(a),(b)和(c)可以发现,在不同风流条件下,高温区域蔓延路径均呈非线性移动规律. 当高温区域向上蔓延时,只有在风流为2 m·s−1时的2#测点处观察到300 ℃高温. 而当高温区域向下蔓延时,三组实验在第三、四层高温区域均出现在5#、8#测点处. 对于第三层5#测点,距离加热棒最近(距离70 mm),停止加热时最先达到300 ℃,并且开始向周围蔓延. 而第四层8#测点位于5#测点垂直正下方70 mm处,相比于同一层的其他两测点距离更近,因此温度变化受5#测点影响较大. 同时发现,第五层至第七层高温区域蔓延路径受风流影响较大,在风流0 m·s−1时,高温区域由中部向西测区域偏移,依次沿10#、15#、16#所在的区域向下蔓延;而风流1 m·s−1、2 m·s−1实验条件下,高温区域由中部向东侧区域偏移,与风流方向一致,依次沿12#、13#、18#所在的区域向下蔓延. 分析其原因,当松散煤层表面有风流流过时,一部分氧气沿孔隙进入炉体内部,受风向的影响,使得炉体东侧区域氧气充足,从而导致东侧区域煤样发生氧化反应的程度更高,温度蔓延更快.
![]() 图 7 高温区域蔓延路径. (a)风流0 m·s−1;(b)风流1 m·s−1;(c)风流2 m·s−1Figure 7. Spread path in high-temperature area: (a) wind flow of 0 m·s−1; (b) wind flow of 1 m·s−1; (c) wind flow of 2 m·s−1
图 7 高温区域蔓延路径. (a)风流0 m·s−1;(b)风流1 m·s−1;(c)风流2 m·s−1Figure 7. Spread path in high-temperature area: (a) wind flow of 0 m·s−1; (b) wind flow of 1 m·s−1; (c) wind flow of 2 m·s−12.4 关键点气体浓度变化规律
实验过程中,当某一层的测点温度达到30 ℃时,开始对该层所有测点进行抽气. 当检测到第7层测点温度达到300 ℃时,停止取气,实验结束. 定义每层测点中的最高温度点为关键点.
2.4.1 CO浓度变化规律
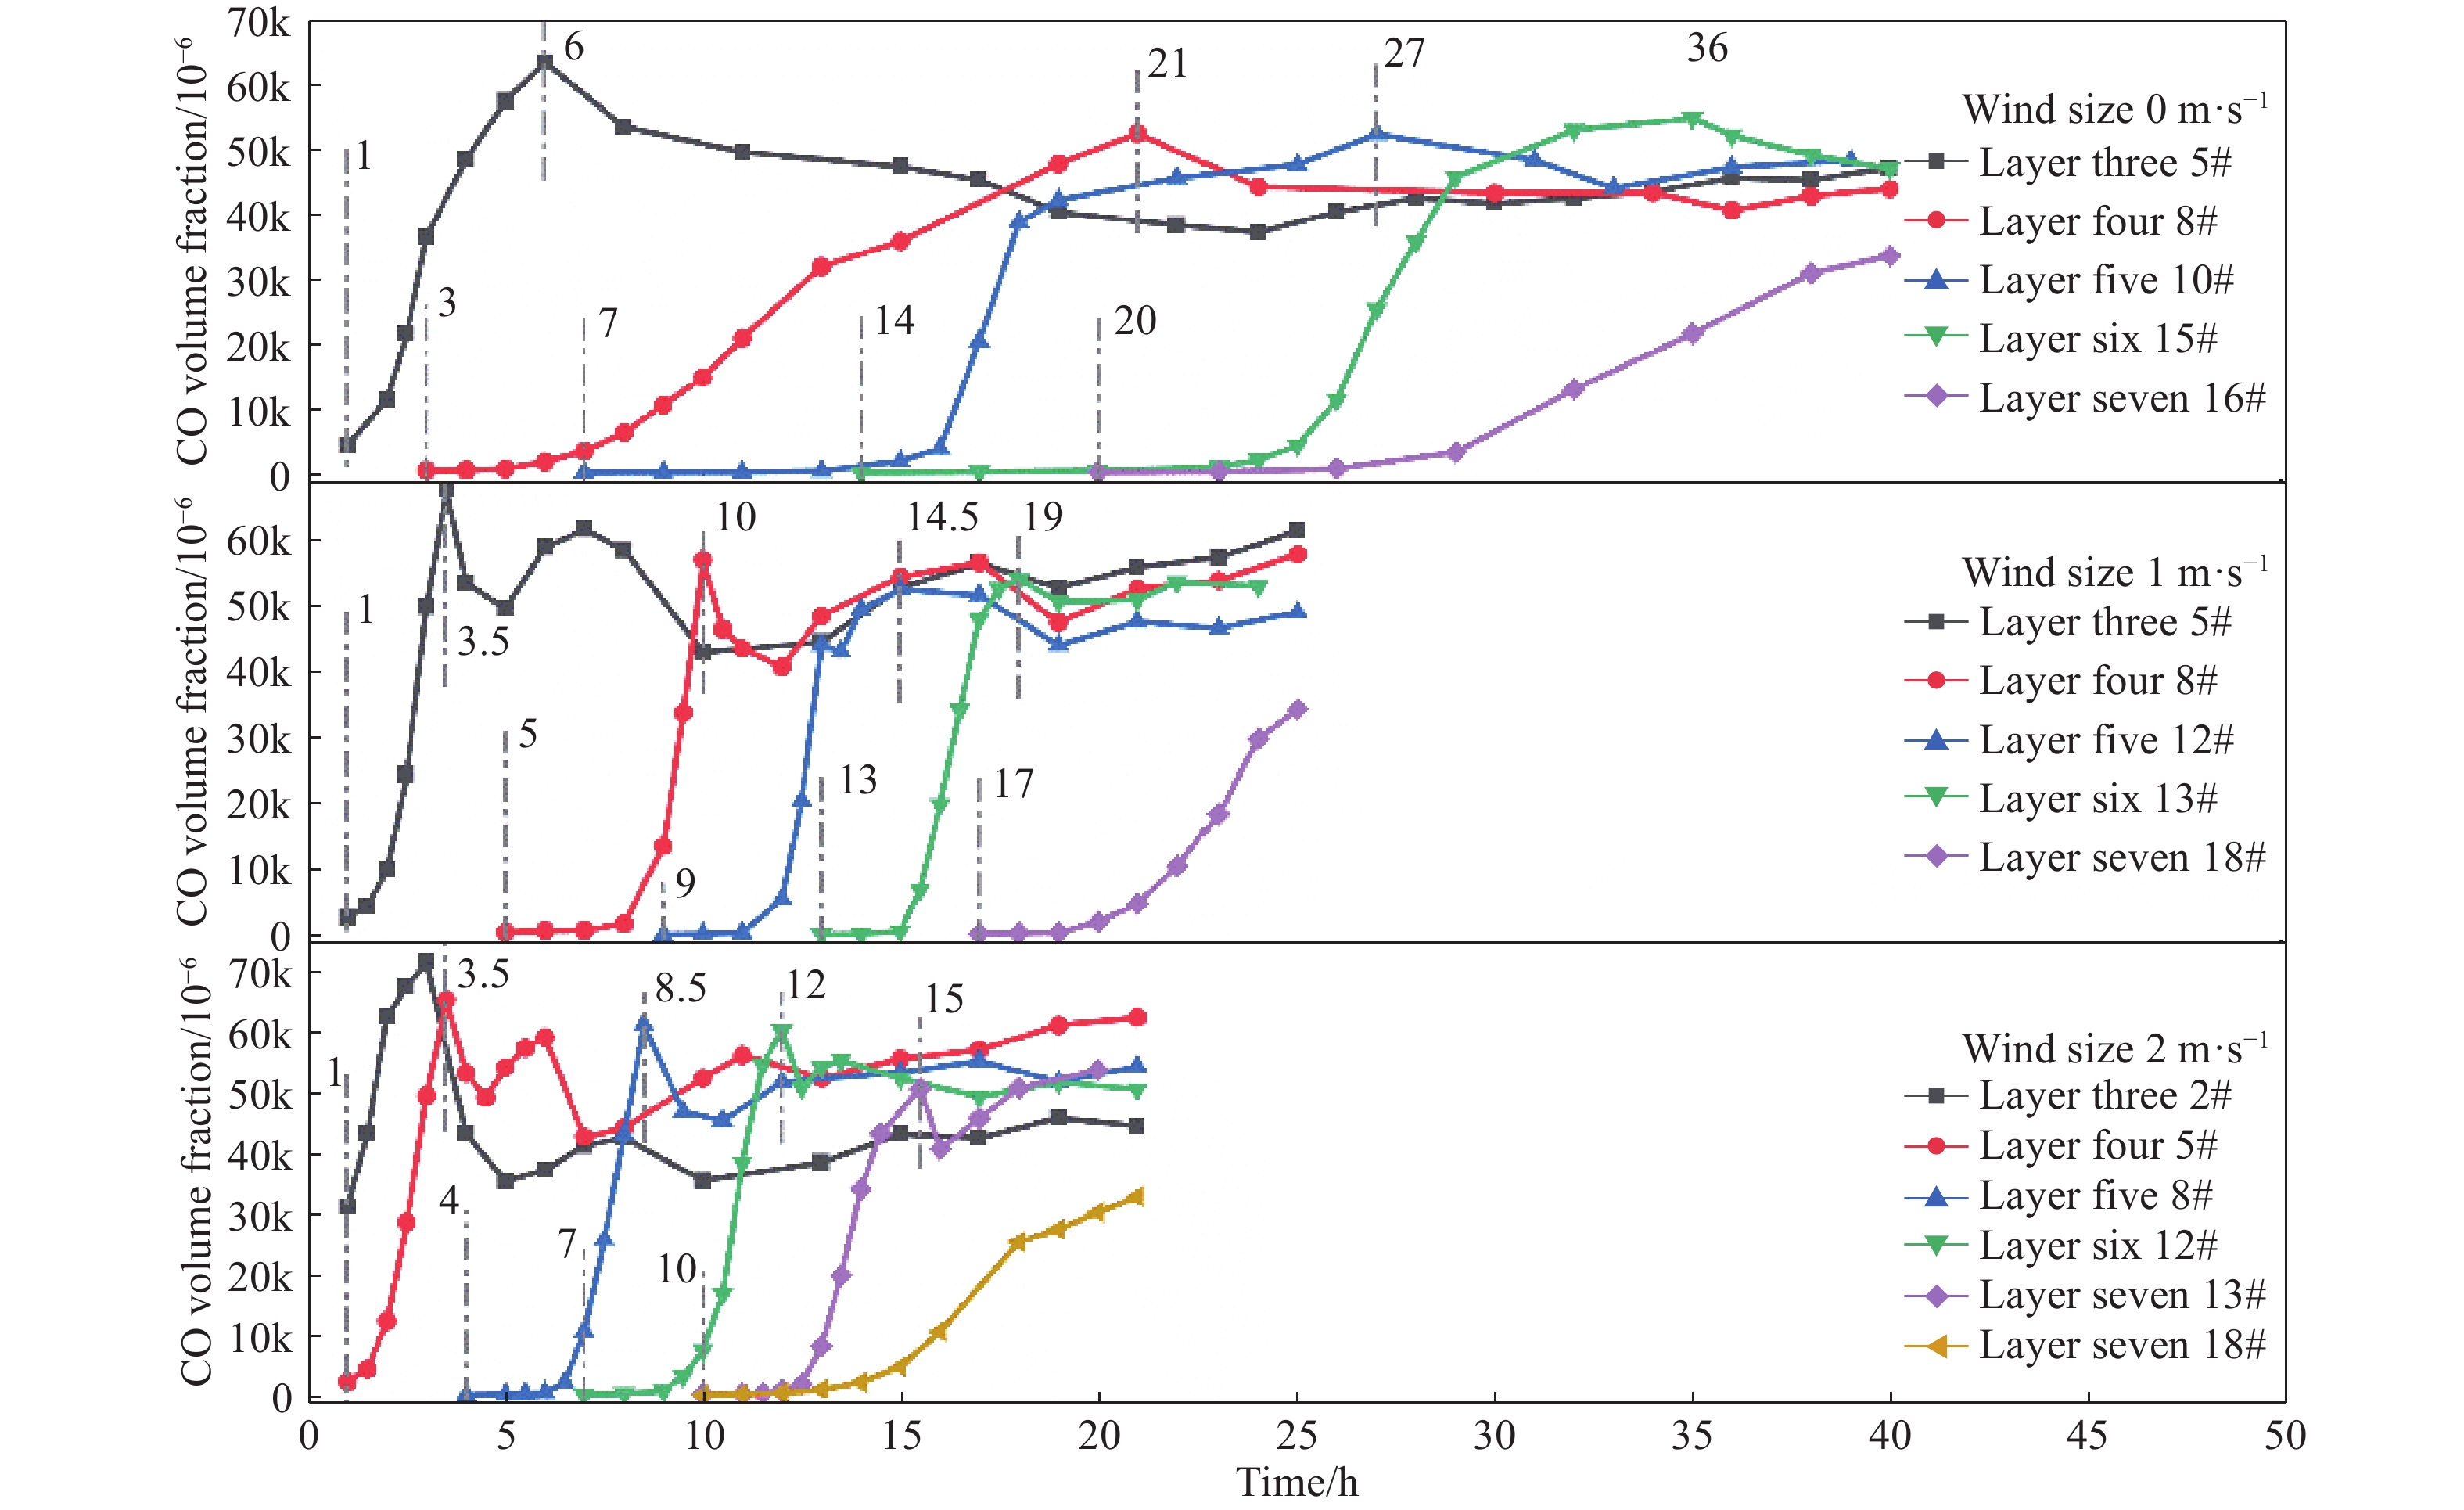
在纵深方向上,各层关键点处CO浓度表现出不同的变化规律(如图8所示). 在风流作用下,第三至六层关键点处CO浓度达到峰值后出现明显波动趋势. 一方面,煤氧反应受表面风流影响[12];另一方面,随着反应持续进行,下层煤氧反应产生的CO气体受到热浮力与热扩散作用开始向上层蔓延[32].
![]() 图 8 高温区域关键点CO体积分数随时间变化规律Figure 8. CO concentrations with time at key points in the high-temperature region
图 8 高温区域关键点CO体积分数随时间变化规律Figure 8. CO concentrations with time at key points in the high-temperature region定义1:关键点处CO浓度达到峰值的时间与关键点达到300 ℃时间的差为Δh1.
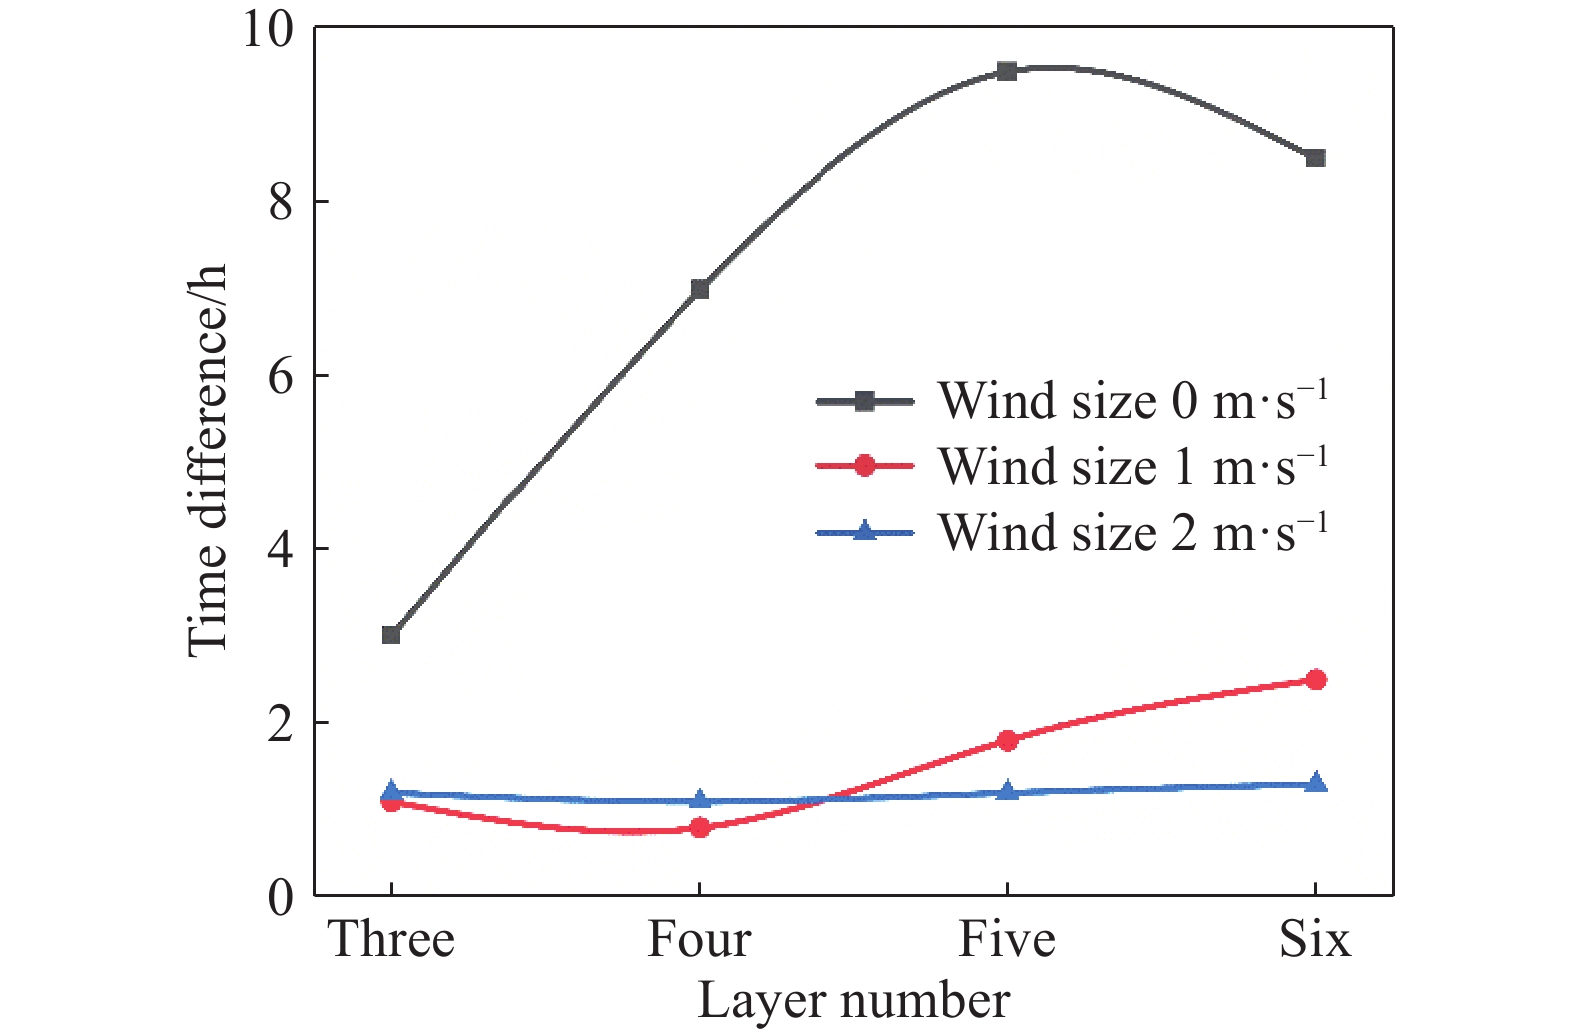
图9为关键点处CO浓度达到峰值的时间与关键点达到300 ℃的时间差随层数变化曲线. 在风流0 m·s−1时,随着纵深的增加Δh1持续增大,即温度越向下蔓延,煤样反应越困难所需时间越长. 在风流1 m·s−1时,随着纵深的增加Δh1先减小再增大,整个煤氧反应过程Δh1维持在1.4±1 h范围内. 在风流2 m·s−1时,随着纵深的增加Δh1不变,整个煤氧反应过程Δh1维持在0.9 h. 说明表面风流加剧煤氧反应,使燃烧蔓延更快.
![]() 图 9 CO浓度峰值与高温关键点时间差随层数增加曲线图Figure 9. Time difference between peak CO concentration and high-temperature key points with the increase in layer number
图 9 CO浓度峰值与高温关键点时间差随层数增加曲线图Figure 9. Time difference between peak CO concentration and high-temperature key points with the increase in layer number2.4.2 O2浓度变化规律
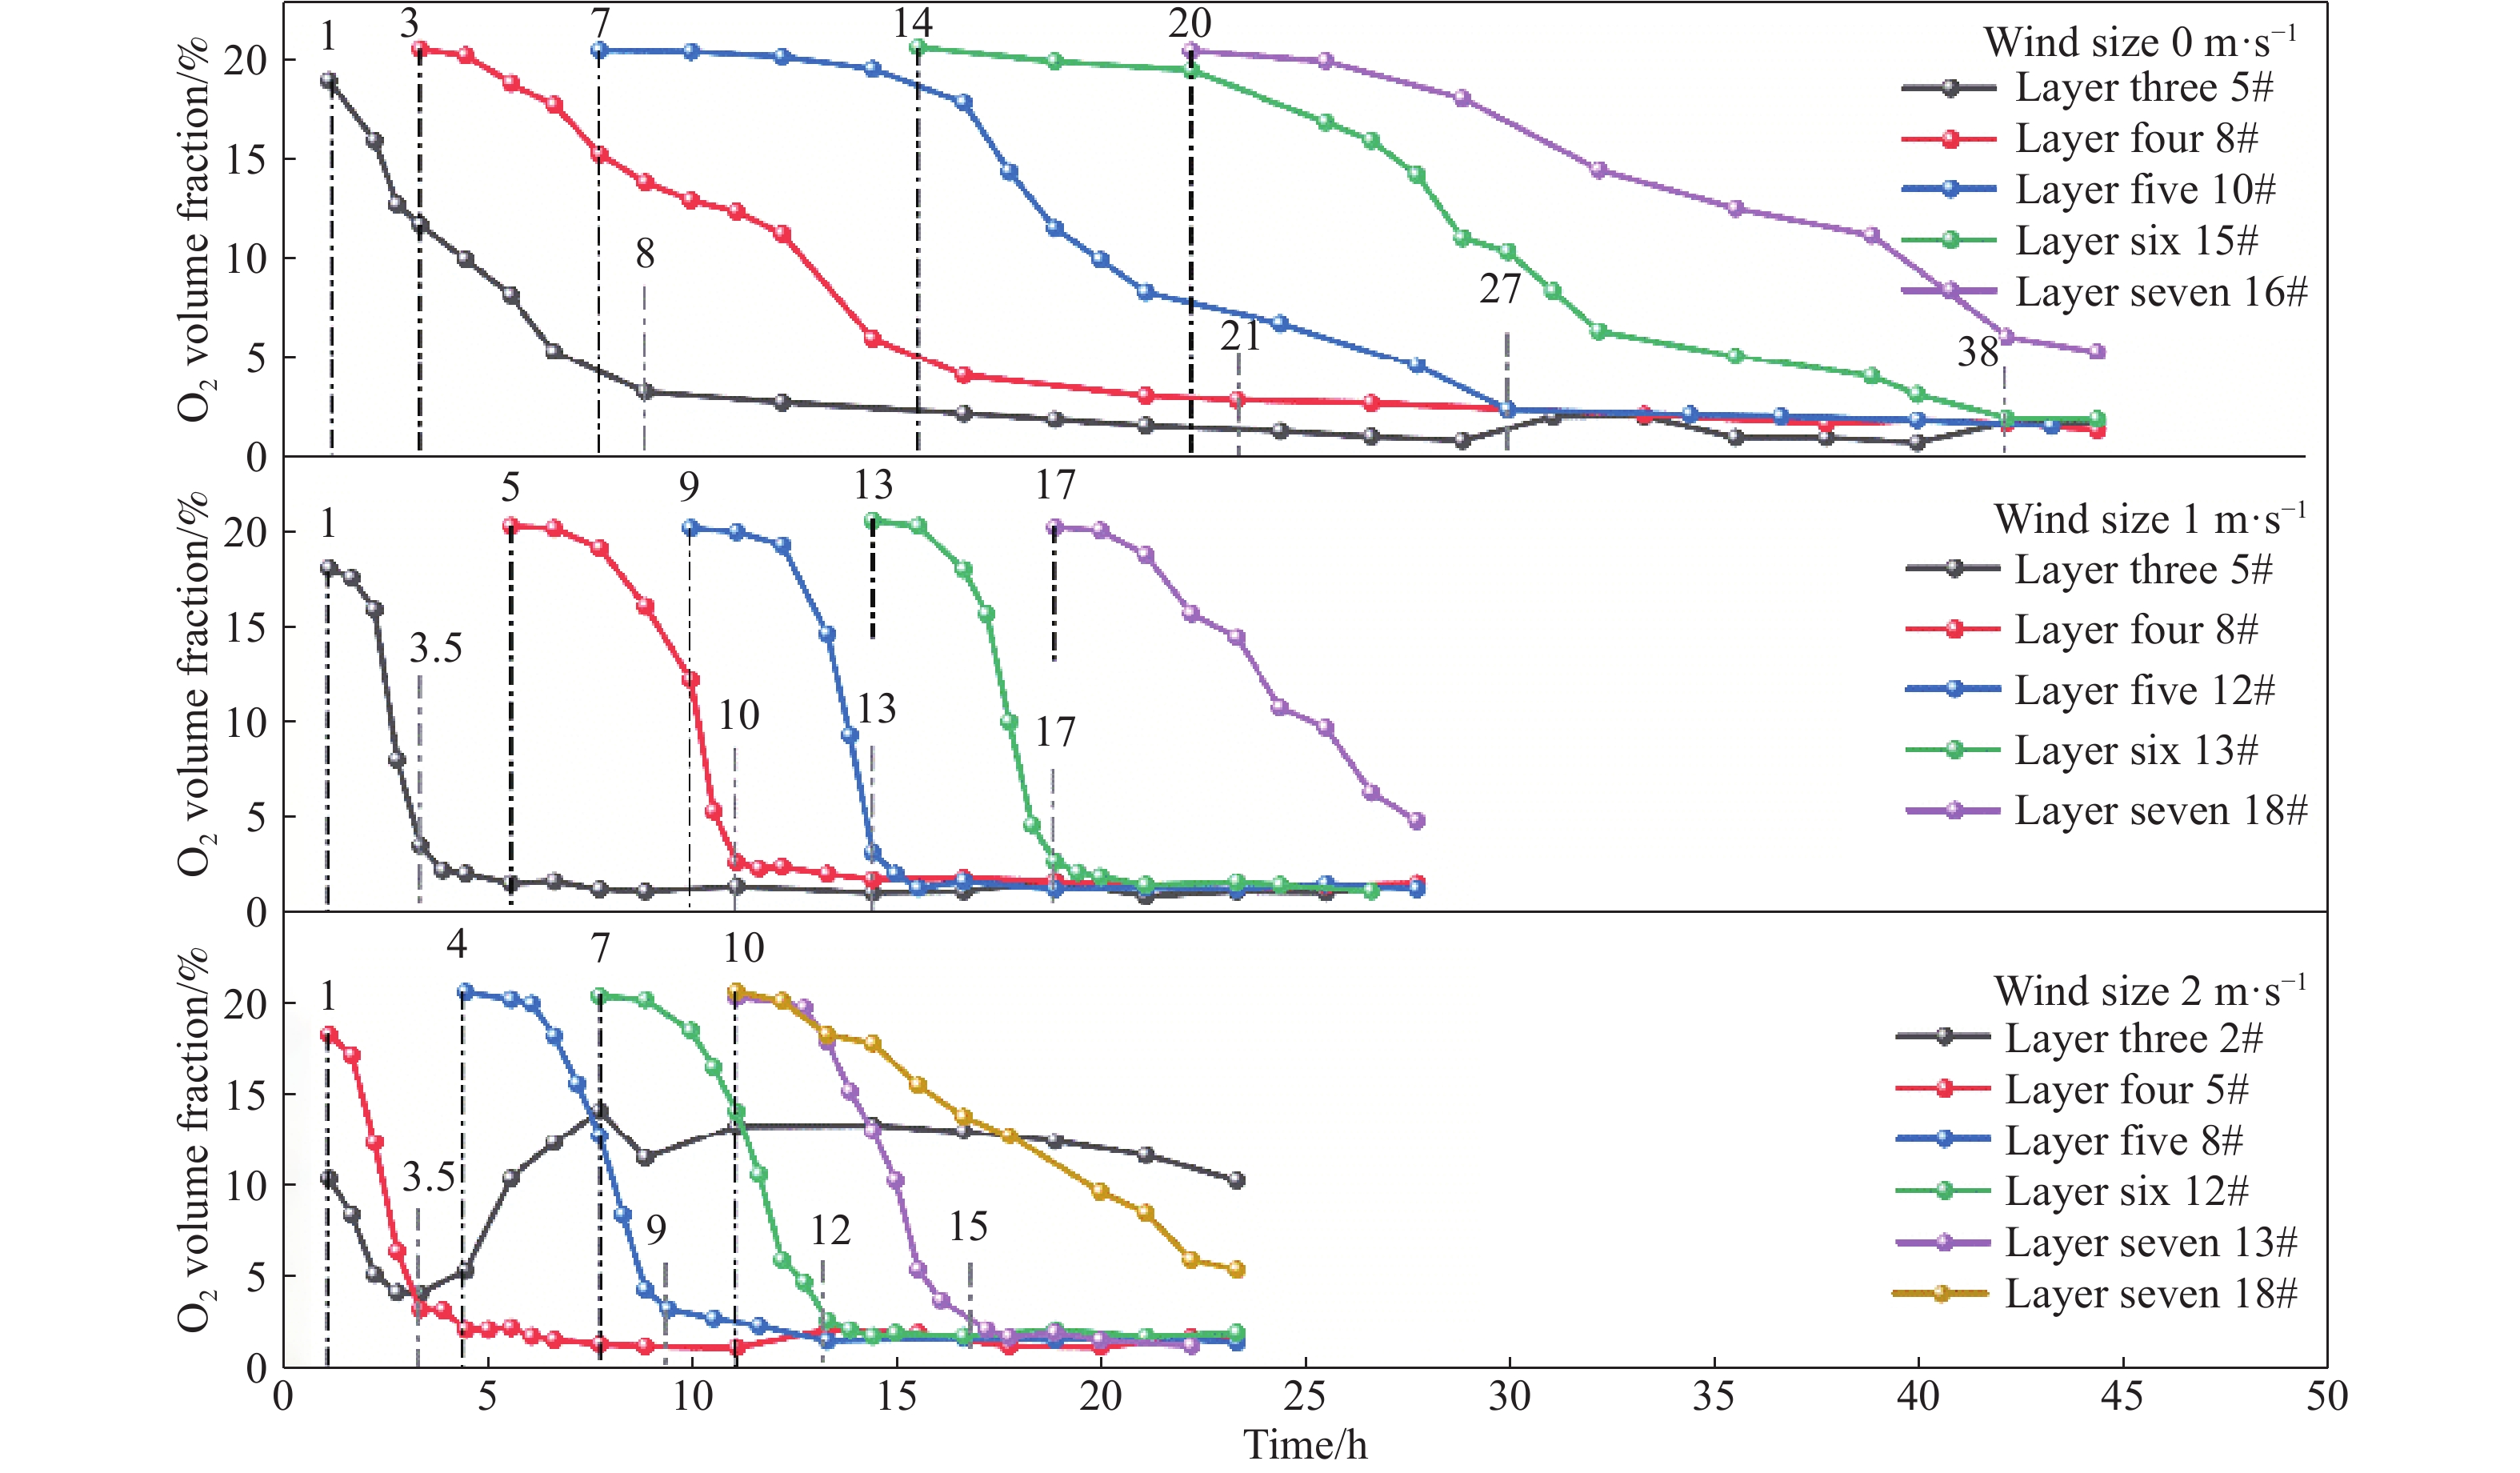
随着纵深的增加,各层关键点O2体积分数由浅向深依次开始降低(如图10所示). 当各层关键点氧气体积分数下降到3%时,即达到极限O2体积分数状态. 在风流0 m·s−1时,第三至六层关键点达到极限O2体积分数所经历的时间依次为7、18、20和24 h. 在风流1 m·s−1时,第三至六层关键点达到极限O2体积分数所经历的时间依次为2.5、5、4和4 h. 在风流2 m·s−1时,第三至六层关键点达到极限O2体积分数所经历的时间依次为2.5、5、5和5 h. 即风流明显加剧了炉体内关键点处煤氧反应速率,导致该处O2快速降低.
![]() 图 10 高温区域关键点O2体积分数随时间变化规律Figure 10. Changes in oxygen concentration with time at key points in the high-temperature region
图 10 高温区域关键点O2体积分数随时间变化规律Figure 10. Changes in oxygen concentration with time at key points in the high-temperature region定义2:关键点处达到极限O2体积分数时间与关键点达到300 ℃的时间差为Δh2.
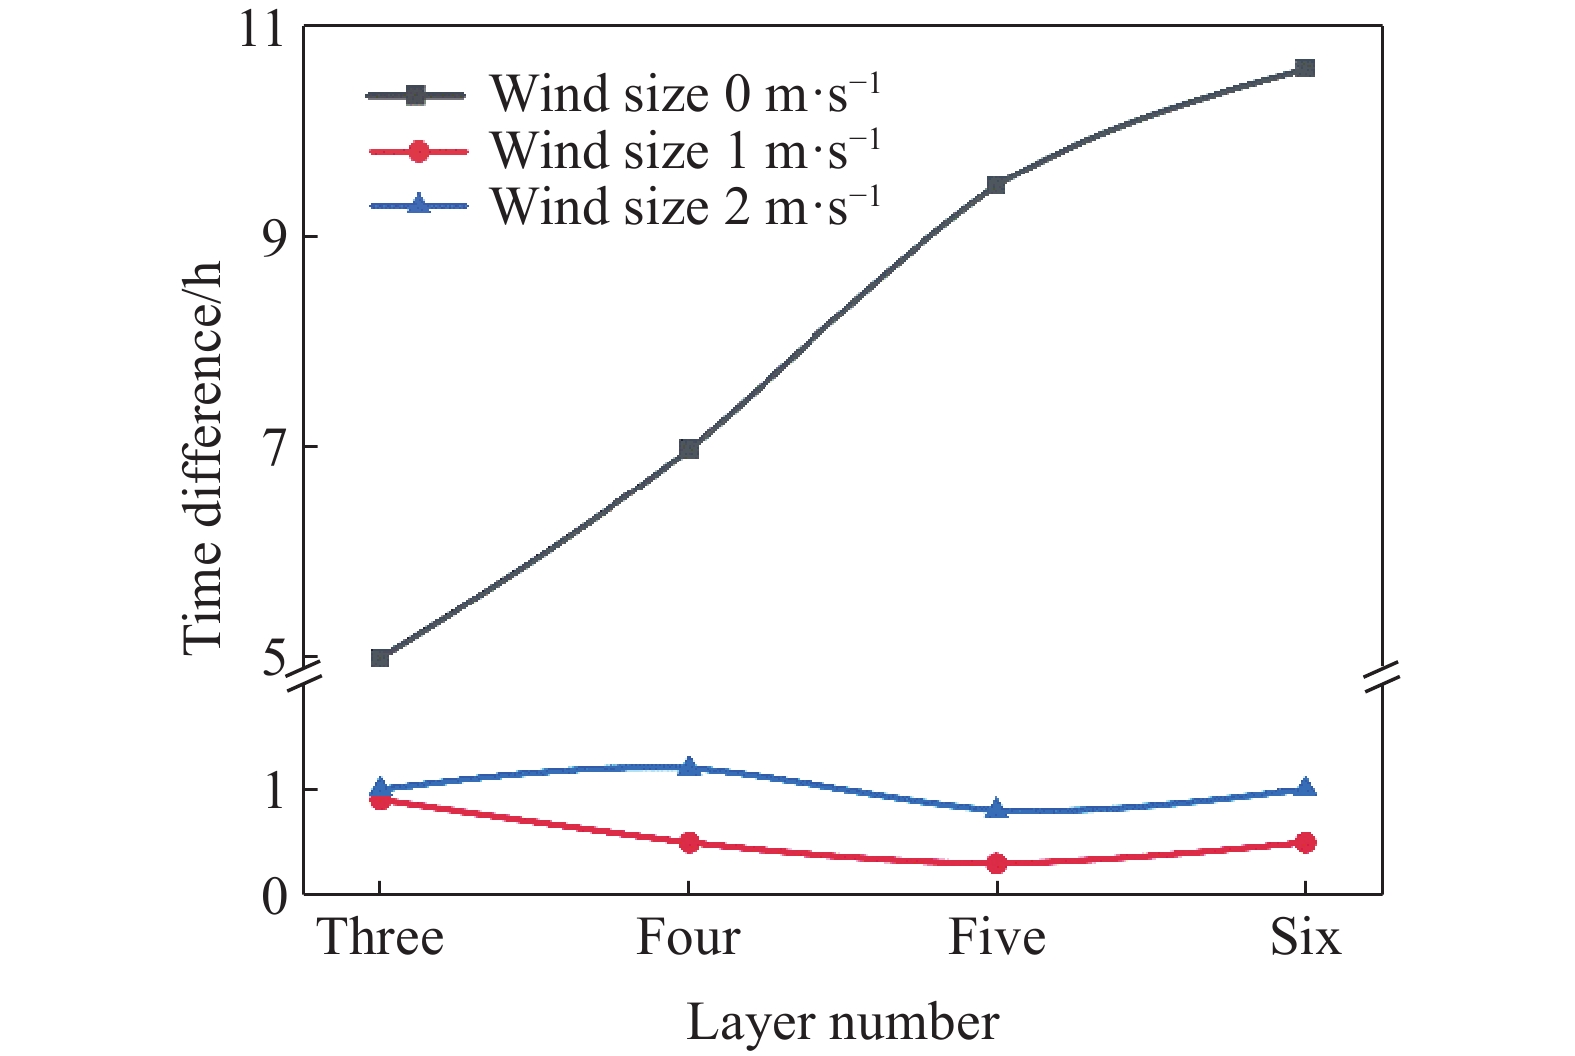
图11为关键点处达到极限O2体积分数时间与关键点达到300 ℃时间的差随层数变化曲线. 在风流0 m·s−1时,随着纵深的增加Δh2持续增大,即温度越向下蔓延,氧气越难以被消耗. 而在风流作用下,Δh2分别维持在0.6±0.3 h(风流1 m·s−1)和1±0.2 h(风流2 m·s−1)范围内. 表明风流能够加剧高温向下蔓延过程中O2的消耗速率,使煤氧反应持续进行. 因此在实际煤火治理时,控制漏风可以减少煤火蔓延趋势.
![]() 图 11 极限O2体积分数与高温关键点到达时间差随层数增加曲线图Figure 11. Time difference between limit O2 concentration and high-temperature key points with the increase of layer number
图 11 极限O2体积分数与高温关键点到达时间差随层数增加曲线图Figure 11. Time difference between limit O2 concentration and high-temperature key points with the increase of layer number3. 结论
(1)采用自行搭建的敞车载运下煤燃烧蔓延实验模型,针对选取的易自燃实验煤样,再现了表面风流作用下煤样内部高温区域演变规律.
(2)受表面横向风流影响,松散煤体内部燃烧蔓延时间明显缩短,相比无风流条件,燃烧蔓延时间分别缩短了0.3倍(风流1 m·s−1)和0.5倍(风流2 m·s−1),高温区域峰值温度升高了120±20 ℃.
(3)松散煤体高温区域峰值温度演变路径呈非线性规律. 受表面横向风流影响,蔓延路径向风流方向偏移. 无风流作用时,煤体中高温区域关键点O2体积分数快速下降阶段所经历的时间随纵深的增加逐渐增大,风流作用会加剧煤氧反应进程,缩短反应时间. 因此在实际煤火治理时,控制漏风可以减少煤火蔓延趋势.
(4)本文研究成果能够为煤炭运输过程自燃演化规律的研究提供借鉴,但由于本研究只针对一种实验煤样,因此需进一步开展普适性研究.
-
![]()
图 2 煤自燃敞车载运系统图
Figure 2. Coal spontaneous combustion gondola transportation system diagram
![]()
图 3 煤自燃敞车载运实验装置图. (a)敞车载运实验模型; (b)风筒内部结构图
Figure 3. Coal spontaneous combustion gondola transportation experimental device diagram: (a) gondola transport experimental model; (b) internal structure of the blower
![]()
图 4 炉体测点分布图. (a)测点外侧编号图; (b)测点内部位置图
Figure 4. Distribution map of measuring points on the left side of the furnace body: (a) outside number of measuring points; (b) internal position of the measuring point
![]()
图 5 CO体积分数及其气体增长率与温度变化曲线
Figure 5. CO concentration and growth rate curve with temperature
![]()
图 6 测点温度随时间变化曲线. (a) 第一层测点; (b) 第三层测点; (c) 第四层测点; (d) 第五层测点; (e) 第六层测点; (f) 第七层测点
Figure 6. Temperature curves with time of the measurement points: (a) layer one; (b) layer three; (c) layer four; (d) layer five; (e) layer six; (f) layer seven
![]()
图 7 高温区域蔓延路径. (a)风流0 m·s−1;(b)风流1 m·s−1;(c)风流2 m·s−1
Figure 7. Spread path in high-temperature area: (a) wind flow of 0 m·s−1; (b) wind flow of 1 m·s−1; (c) wind flow of 2 m·s−1
![]()
图 8 高温区域关键点CO体积分数随时间变化规律
Figure 8. CO concentrations with time at key points in the high-temperature region
![]()
图 9 CO浓度峰值与高温关键点时间差随层数增加曲线图
Figure 9. Time difference between peak CO concentration and high-temperature key points with the increase in layer number
![]()
图 10 高温区域关键点O2体积分数随时间变化规律
Figure 10. Changes in oxygen concentration with time at key points in the high-temperature region
![]()
图 11 极限O2体积分数与高温关键点到达时间差随层数增加曲线图
Figure 11. Time difference between limit O2 concentration and high-temperature key points with the increase of layer number
表 1 煤样工业分析和元素分析
Table 1 Proximate and ultimate analysis of coal sample
Proximate analysis (mass fraction)/% Ultimate analysis (mass fraction)/% Mad Vad Aad FCad C H O N S 11.2 23.1 7.86 57.84 62.96 2.56 33.24 0.69 0.55  下载: 导出CSV
表 2 实验煤样质量及粒径分布
Table 2 Particle size distribution and mass of coal samples
Experimental Coal particle size/ mm Coal sample mass/g Temperature-programmed experiment 0–0.9, 0.9–3, 3–5, 5–7, 7–10 Each 200 Similar simulation experiment of gondola car transporting coal 7–10 60000
下载: 导出CSV
表 3 实验风流条件
Table 3 Experimental wind conditions
Experiment number Wind size /(m·s−1) Fan speed /(r·min−1) 1 0 0 2 1 800 3 2 1000
下载: 导出CSV
表 4 测点深度及插入炉体内的距离
Table 4 Depth of measuring point and distance inserted into the furnace
Layers Depth/mm Measuring point
numberDistance /mm Measuring point
numberDistance /mm Measuring point
numberDistance /mm Layer one 30 1# 50 2# 150 3# 250 Layer three 170 4# 250 5# 150 6# 50 Layer four 240 7# 50 8# 150 9# 250 Layer five 310 10# 250 11# 150 12# 50 Layer six 380 13# 50 14# 150 15# 250 Layer seven 450 16# 250 17# 150 18# 50
下载: 导出CSV
-
[1] 余明高, 王亮, 李海涛, 等. 我国煤矿防灭火材料的研究现状及发展趋势. 矿业安全与环保, https://kns.cnki.net/kcms/detail/50.1062.TD.20220624.1113.002.html Yu M G, Wang L, Li H T, et al. Research status and development of mine fire prevention materials in China. Min Saf Environ Prot, https://kns.cnki.net/kcms/detail/50.1062.TD.20220624.1113.002.html
[2] Li Q W, Xiao Y, Zhong K Q, et al. Overview of commonly used materials for coal spontaneous combustion prevention. Fuel, 2020, 275: 117981 doi: 10.1016/j.fuel.2020.117981
[3] 周军, 康文超. 煤炭自燃的原因及对策研究. 铁道货运, 2009, 27(12):24 doi: 10.3969/j.issn.1004-2024.2009.12.008 Zhou J, Kang W C. Study on causes of coal spontaneous combustion and the countermeasures. Railw Freight Transp, 2009, 27(12): 24 doi: 10.3969/j.issn.1004-2024.2009.12.008
[4] Lu X, Deng J, Xiao Y, et al. Recent progress and perspective on thermal-kinetic, heat and mass transportation of coal spontaneous combustion hazard. Fuel, 2022, 308: 121234 doi: 10.1016/j.fuel.2021.121234
[5] Wang K, Wang Z, Zhai X W, et al. An experimental investigation of early warning index for coal spontaneous combustion with consideration of particle size: A case study. Int J Coal Prep Util, 2023, 43(2): 233 doi: 10.1080/19392699.2022.2036730
[6] Wang K, Han T, Deng J, et al. Comparison of combustion characteristics and kinetics of Jurassic and Carboniferous-Permian coals in China. Energy, 2022, 254: 124315 doi: 10.1016/j.energy.2022.124315
[7] 韩启. 防止铁路运输煤炭发生自燃的探讨. 铁道货运, 2012, 30(9):6 doi: 10.3969/j.issn.1004-2024.2012.09.002 Han Q. Discussion on preventing spontaneous combustion of coal transported by railway. Railw Freight Transp, 2012, 30(9): 6 doi: 10.3969/j.issn.1004-2024.2012.09.002
[8] 李可佳, 杨广全, 陆松. 铁路运输煤炭自燃防控对策的探讨. 铁道货运, 2016, 34(5):35 doi: 10.16669/j.cnki.issn.1004-2024.2016.05.08 Li K J, Yang G Q, Lu S. Discussion on countermeasures of coal self-ignition prevention and control during railway transportation. Railw Freight Transp, 2016, 34(5): 35 doi: 10.16669/j.cnki.issn.1004-2024.2016.05.08
[9] 孙越. 煤自燃倾向性及测定中的影响因素. 煤炭与化工, 2017, 40(8):154 doi: 10.19286/j.cnki.cci.2017.08.049 Sun Y. Tendency of coal spontaneous combustion and the influence factors in its determination. Coal Chem Ind, 2017, 40(8): 154 doi: 10.19286/j.cnki.cci.2017.08.049
[10] Zhang Y N, Shu P, Deng J, et al. Analysis of oxidation pathways for characteristic groups in coal spontaneous combustion. Energy, 2022, 254: 124211 doi: 10.1016/j.energy.2022.124211
[11] 费金彪, 文虎. 小风量对煤低温氧化产生气体的影响研究. 煤矿安全, 2017, 48(10):21 doi: 10.13347/j.cnki.mkaq.2017.10.006 Fei J B, Wen H. Study on the effect of small airflow on gas production of low temperature oxidation of coal. Saf Coal Mines, 2017, 48(10): 21 doi: 10.13347/j.cnki.mkaq.2017.10.006
[12] 周西华, 牛玉平, 白刚. 供风量对褐煤自燃特性参数影响的实验研究. 矿业安全与环保, 2020, 47(1):31 doi: 10.19835/j.issn.1008-4495.2020.01.007 Zhou X H, Niu Y P, Bai G. Experimental study on the influence of air supply on characteristics of lignite spontaneous combustion. Min Saf Environ Prot, 2020, 47(1): 31 doi: 10.19835/j.issn.1008-4495.2020.01.007
[13] 邢震. 浅埋厚煤层地表漏风对采空区煤自燃影响数值模拟研究. 工矿自动化, 2021, 47(2):80 doi: 10.13272/j.issn.1671-251x.2020100018 Xing Z. Numerical simulation study on the influence of surface air leakage in shallow thick coal seam on coal spontaneous combustion in goaf. Ind Mine Autom, 2021, 47(2): 80 doi: 10.13272/j.issn.1671-251x.2020100018
[14] 郝宇, 逄锦伦. 不同风量和瓦斯条件下采空区自燃“三带”分布规律. 矿业安全与环保, 2020, 47(2):40 doi: 10.19835/j.issn.1008-4495.2020.02.008 Hao Y, Pang J L. The distribution law of spontaneous combustion of “three zones”in goaf under different ventilation volume and gas condition. Min Saf Environ Prot, 2020, 47(2): 40 doi: 10.19835/j.issn.1008-4495.2020.02.008
[15] 齐庆杰, 祁云, 周新华. 供风量对采空区自燃动态影响及防灭火技术. 中国安全科学学报, 2019, 29(4):120 doi: 10.16265/j.cnki.issn1003-3033.2019.04.019 Qi Q J, Qi Y, Zhou X H. Dynamic effects of air supply volume on spontaneous combustion in goafs and fire prevention and extinguishing technology. China Saf Sci J, 2019, 29(4): 120 doi: 10.16265/j.cnki.issn1003-3033.2019.04.019
[16] 郭亚军, 邬剑明, 王俊峰, 等. 风量对煤自燃极限参数影响的实验研究. 煤矿安全, 2018, 49(2):27 Guo Y J, Wu J M, Wang J F, et al. Experimental study on the effect of air volume on coal spontaneous combustion limit parameters. Saf Coal Mines, 2018, 49(2): 27
[17] 王凯, 和运中, 尚博. 预氧化对煤复燃极限参数影响的实验研究. 煤矿安全, 2020, 51(7):31 doi: 10.13347/j.cnki.mkaq.2020.07.007 Wang K, He Y Z, Shang B. Experimental study of pre-oxidation effect on limit parameters of coal secondary spontaneous combustion. Saf Coal Mines, 2020, 51(7): 31 doi: 10.13347/j.cnki.mkaq.2020.07.007
[18] Zhang Y N, Chen L, Deng J, et al. Influence of granularity on thermal behaviour in the process of lignite spontaneous combustion. J Therm Anal Calorim, 2019, 135(4): 2247 doi: 10.1007/s10973-018-7440-3
[19] 李浩森, 吴冬冬. 党家河矿煤自燃临界温度及自燃倾向性研究. 煤, 2019, 28(5):10 doi: 10.3969/j.issn.1005-2798.2019.05.003 Li H S, Wu D D. Research on the critical temperature and self-combustion tendency of coal in dangjiahe mine. Coal, 2019, 28(5): 10 doi: 10.3969/j.issn.1005-2798.2019.05.003
[20] 王海燕, 朱红青, 姚海飞, 等. 基础内因参数对煤自燃低温临界温度的影响. 应用基础与工程科学学报, 2016, 24(3):499 doi: 10.16058/j.issn.1005-0930.2016.03.007 Wang H Y, Zhu H Q, Yao H F, et al. Influence of fundamentally inner parameters to critical temperature of low temperature stage in coal self-ignition process. J Basic Sci Eng, 2016, 24(3): 499 doi: 10.16058/j.issn.1005-0930.2016.03.007
[21] 金永飞, 郭军, 文虎, 等. 煤自燃高温贫氧氧化燃烧特性参数的实验研究. 煤炭学报, 2015, 40(3):596 doi: 10.13225/j.cnki.jccs.2014.0626 Jin Y F, Guo J, Wen H, et al. Experimental study on the high temperature lean oxygen oxidation combustion characteristic parameters of coal spontaneous combustion. J China Coal Soc, 2015, 40(3): 596 doi: 10.13225/j.cnki.jccs.2014.0626
[22] Deng J, Wang K, Zhang Y N, et al. Study on the kinetics and reactivity at the ignition temperature of Jurassic coal in North Shaanxi. J Therm Anal Calorim, 2014, 118(1): 417 doi: 10.1007/s10973-014-3974-1
[23] 王秋红, 靳松灵, 罗振敏, 等. 煤变质程度对煤燃烧动力学参数的影响. 安全与环境工程, 2022, 29(3):62 Wang Q H, Jin S L, Luo Z M, et al. Influence of metamorphism degree on kinetic parameters of coal combustion. Saf Environ Eng, 2022, 29(3): 62
[24] 邓军, 宋佳佳, 赵婧昱, 等. 高温氧化条件下风化煤自燃特性试验研究. 煤炭科学技术, 2017, 45(1):73 Deng J, Song J J, Zhao J Y, et al. Experiment study on spontaneous combustion features of weathered coal under condition of high temperature oxidation. Coal Sci Technol, 2017, 45(1): 73
[25] 邓军, 赵婧昱, 张嬿妮. 基于指标气体增长率分析法测定煤自燃特征温度. 煤炭科学技术, 2014, 42(7):49 doi: 10.13199/j.cnki.cst.2014.07.013 Deng J, Zhao J Y, Zhang Y N. Study on determination of coal spontaneous combustion characteristic temperature based on analysis method of index gas growth-rate. Coal Sci Technol, 2014, 42(7): 49 doi: 10.13199/j.cnki.cst.2014.07.013
[26] 刘东. 不同变质程度烟煤的传热特性实验研究. 煤矿安全, 2022, 53(4):45 Liu D. Experimental study on heat transfer characteristics of bituminous coal with different metamorphic degrees. Saf Coal Mines, 2022, 53(4): 45
[27] 王凯, 韩涛, 和运中. 风量影响下的煤自燃定量预测预报指标试验研究. 西安科技大学学报, 2022, 42(1):16 Wang K, Han T, He Y Z. Experimental study on quantitative prediction indexes of coal spontaneous combustion based on air supply. J Xi’an Univ Sci Technol, 2022, 42(1): 16
[28] Onifade M, Genc B. A review of research on spontaneous combustion of coal. Int J Min Sci Technol, 2020, 30(3): 303 doi: 10.1016/j.ijmst.2020.03.001
[29] 郭文杰. 煤自燃特性影响因素的试验研究. 安全与环境学报, 2018, 18(4):1307 doi: 10.13637/j.issn.1009-6094.2018.04.012 Guo W J. Experimental test and examination of the influential factors of the coal spontaneous combustion. J Saf Environ, 2018, 18(4): 1307 doi: 10.13637/j.issn.1009-6094.2018.04.012
[30] 褚廷湘, 李品, 余明高. 水分相变下松散煤体导热系数的数值模拟研究. 煤炭学报, 2017, 42(7):1782 Chu T X, Li P, Yu M G. Simulation study of water phase transition effects on thermal conductivity of loose coal. J China Coal Soc, 2017, 42(7): 1782
[31] 梁运涛, 辛全昊, 王树刚, 等. 煤自然发火过程颗粒堆积体结构形态演化实验研究. 煤炭学报, 2020, 45(4):1398 Liang Y T, Xin Q H, Wang S G, et al. Structure variation of coal particle packing during the spontaneous combustion. J China Coal Soc, 2020, 45(4): 1398
[32] 李林. 采空区煤自燃环境瓦斯运移积聚规律研究[学位论文]. 徐州:中国矿业大学, 2020 Li L. Study on Methane Migration and Accumulation in Spontaneous Coal Combustion Environment of A Coal Mined-out Area [Dissertation]. Xuzhou: China University of Mining and Technology, 2020


计量
- 文章访问数: 436
- HTML全文浏览量: 66
- PDF下载量: 75
