
-
摘要:
提出一种基于参考模型的视网膜特征量化方法,结合医生诊断过程中关注的视网膜形态变化特征,提出一系列适用于计算机判断分析视网膜状态的可量化特征.在完成正常光学相干断层成像(OCT)中视网膜内界膜(ILM)、光感受器内外节交界处(ISOS)、布鲁赫膜(BM)分割提取的基础上,利用统计方法构建正常视网膜参考模型.结合参考模型和医生所关注的视网膜厚度、边界平滑度以及边界连续性,实现视网膜不同区域厚度特征、厚度比值特征、梯度特征、曲率、标准差、相关系数特征的计算.基于正常OCT图像所构建的参考模型,获取了正常视网膜的厚度及形态特征量化数值.通过分析比较异常OCT图像与参考模型特征数值之间的差异,可以对应表征出异常图像中病变导致的异常形态所在位置及严重程度.实验结果表明,通过参考模型获得的正常视网膜特征信息可以为医生提供数值参考,同时对异常OCT图像量化得到的特征数值可以表现出图像中的异常形态,为后续的异常判断提供基础.
Abstract:Optical coherence tomography (OCT) plays an important role in the diagnosis of ocular fundus diseases. Retinal OCT images contain a large amount of useful information for the diagnosis of ocular fundus diseases and are often used to detect small lesions of the fundus. At present, many medical researchers have used OCT to determine the statistical characteristics of the retina to analyze various fundus diseases. When interpreting the OCT images, ophthalmologists will focus on the location of the lesions in the images and the characteristic morphology conducive to abnormal judgment and compare the histological structure of specific objects in the images with the known normal morphology. In the comparison process, the ophthalmologist will conduct a variety of quantitative analyses of OCT retinal images and determine the severity of the abnormalities and the location of the lesions. Finally, on the basis of the differences between the morphologies and types of diseases, the diagnostic decision is obtained. However, at present, OCT instruments generally only provide the thickness, area, and other commonly used characteristic data, and these data are often inadequate to determine the disease. Computer graphics processing technology has been applied to the auxiliary analysis of OCT images. However, this kind of research often confines the object of study to several specific fundus diseases and makes targeted selection of quantitative features. In the actual diagnosis process, it is difficult to confine the retinal images to some known abnormal cases because of the complexity of the situation. In this study, a retinal feature quantization method based on a reference model was proposed, and a series of quantifiable features suitable for computer judgment and analysis of retinal state were proposed. On the basis of the segmentation and extraction of the internal limiting membrane (ILM), junctions of the inner and outer segments of photoreceptors (ISOS) and Bruch's membrane (BM) in normal OCT images, a reference model of normal retina was constructed by the statistical method. Combining the reference model with the retinal thickness, smoothness, and continuity, the thickness characteristics, thickness ratio characteristics, gradient characteristics, curvature, standard deviation, and correlation coefficient characteristics of different regions of the retina were calculated. On the basis of the reference model of normal OCT images, the quantitative values of retinal thickness and morphological characteristics were obtained. By analyzing and comparing the characteristic value differences between abnormal OCT images and reference model, the location and severity of abnormal morphology caused by lesions could be characterized in the abnormal OCT images. The experimental results show that the normal retinal feature information obtained by the reference model can provide a numerical reference for ophthalmologists. At the same time, the characteristic values obtained by quantizing the abnormal OCT images can show the abnormal morphology, which provides a basis for subsequent abnormal judgment.
-
光学相干断层成像(optical coherence tomography,OCT)是一种能够快速获得视网膜微观结构图像的活体成像技术[1]. 视网膜OCT图像包含大量有利于眼底病诊断的信息,常用于发现眼底的微小病变. 目前已有不少医学研究者利用OCT获取视网膜统计特征来分析各种不同的眼底疾病,如糖尿病视网膜病变引起的黄斑水肿[2],非新生血管年龄相关性黄斑病变引起的玻璃膜疣、色素上皮脱离[3]、视网膜劈裂[4]、视网膜前膜、黄斑裂孔、中心性浆液性脉络膜视网膜病[5]等.
眼科医生在解读视网膜OCT图像时会重点关注图像中易发生病变的位置(黄斑区的内界膜、色素上皮层、神经纤维层等)和利于异常判断的特征形态(视网膜厚度、整体形态、边界平滑度、连续性等),并将图像中特定目标的组织结构形态与已知的正常形态进行比较. 在比较的过程中,医生会在脑海中对OCT视网膜图像进行多种量化分析,如视网膜厚度(比)变化、形态改变量等,进而判断其异常严重程度及病变位置. 最后根据这些形态差异要点与医生掌握的疾病类型关联,并给出诊断决策. 但是目前OCT仪器一般只提供厚度、面积等常用特征数据,而这些数据往往不足以判定疾病. 找寻适用于眼底异常分析判别的量化特征是本文研究关键点.
随着眼底OCT图像在临床诊断中的广泛应用,计算机图像处理与分析技术已被应用于该图像领域中. 有关视网膜图像分析的研究逐渐受到广大学者的重视. Liu等[6-7]利用OCT图像中视网膜的几何、纹理、形态等特征来识别正常黄斑与其他三类黄斑病变,但未分析病变程度. Koprowski等[8]研究了限定的三类脉络膜疾病的自动分析方法,进行了特征定义与量化. Xu等[9]对3D视网膜OCT进行神经纤维层分割及数据分析,用于青光眼的检测. Koprowski等[10]利用OCT仪器获取的数据,实现青光眼严重程度的自动分析. Chen等[11]通过对视网膜层光学强度的定量分析来判别视网膜中央动脉阻塞. Hu等[12]通过半自动分割与量化分析厚度,微视野灵敏度,视敏度等特征来判断三类异常膜类别. Rashno等[13]利用图算法实现糖尿病黄斑水肿OCT图像中囊肿区域的自动分割. 这些研究丰富了医学图像领域的研究,改善医学影像的视觉质量,实现医学影像中关键部位的自动分割、提取和识别. 但是这类研究往往将研究对象限定在几种特定的眼底病并且对量化特征也进行了针对性选取. 在实际的诊断过程中,获取的视网膜图像情况复杂,很难局限在某几种已知的异常病例类型范围内.
本文针对OCT仪器仅能提供少量数值特征和计算机分析限定于几种特定眼底病,不具备普适性等不足,提出了一种基于正常视网膜参考模型的系列特征量化方法,增加了适用于多种眼底异常分析判别的量化特征,为计算机在线、远程诊断技术的实际应用奠定基础.
1. 视网膜组织结构
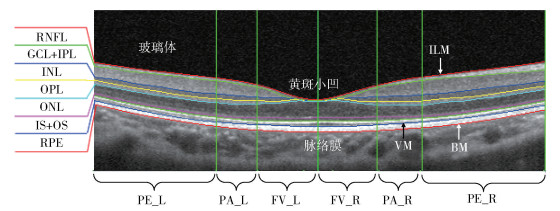
视网膜居于人眼球壁的内层,是一层透明的薄膜,包括多层组织学结构,如图 1所示. 在视网膜的后极部有呈浅漏斗状的凹陷区,是人眼的光学中心,称为黄斑区. 视网膜黄斑区从解刨学上可细分为3个区:①中心凹(fovea),是黄斑区的中心,呈一凹面,直径约1.5mm. 其中心称为黄斑小凹(foveola),约0.35mm直径. ②旁中心凹(parafovea),黄斑外一个宽约0.5mm的环形区域. ③中心凹周围区(perifovea),黄斑周区外一宽约1.5mm的环形区.
![]() 图 1 视网膜黄斑区组织结构ILM: 内界膜; RNFL: 视网膜神经纤维层; GCL+IPL: 神经节细胞层+内丛状层; INL: 内核层; OPL: 外丛状; ONL: 外核层; IS+OS: 光感受器内节段+光感受器外节段; RPE: 色素上皮层; VM: 维尔赫夫膜; BM: 布鲁赫膜; PE_L: 左侧中心凹周围区; PA_L: 左侧旁中心凹; FV_L: 左侧中心凹; FV_R: 右侧中心凹; PA_R: 右侧旁中心凹; PE_R: 右侧中心凹周围区Figure 1. Macular tissue structure of the retina
图 1 视网膜黄斑区组织结构ILM: 内界膜; RNFL: 视网膜神经纤维层; GCL+IPL: 神经节细胞层+内丛状层; INL: 内核层; OPL: 外丛状; ONL: 外核层; IS+OS: 光感受器内节段+光感受器外节段; RPE: 色素上皮层; VM: 维尔赫夫膜; BM: 布鲁赫膜; PE_L: 左侧中心凹周围区; PA_L: 左侧旁中心凹; FV_L: 左侧中心凹; FV_R: 右侧中心凹; PA_R: 右侧旁中心凹; PE_R: 右侧中心凹周围区Figure 1. Macular tissue structure of the retina2. 本文方法
2.1 正常视网膜参考模型
临床实践中,医生是通过将视网膜特定目标及其边界的几何特征和形态与“标准”特征和形态比较来判别差异的大小,作为症状信息. 本文构建正常眼底视网膜的参考模型作为“标准”来比较判别特定目标的差异,进一步获得更多利于医学诊断的量化特征.
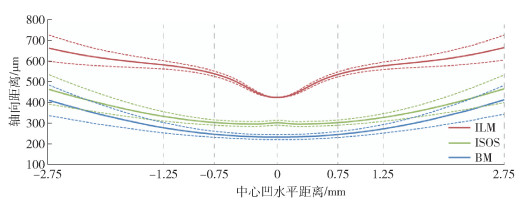
当视网膜黄斑区发生病变时,往往会出现形态上的变异,是病情判断的重要指标. 医学上通常将视网膜定义在内界膜(internal limiting membrane, ILM)和布鲁赫膜(Bruch’s membrane, BM)之间,一些OCT仪器也以这两个边界膜之间的探测数据作为视网膜的厚度数据. 光感受器内外节交界处(ISOS)位于视网膜神经感觉层和色素上皮层之间,并呈现高反射信号,易于识别,同时当发生视网膜脱离时,起到关键区分作用. 因此本文选择ILM、ISOS、BM来建立正常人眼的标准OCT图像的参考模型.
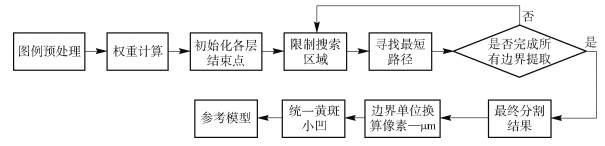
以100张正常的OCT图像作为参考模型的数据集. ILM、ISOS、BM边界的准确提取是构建视网膜参考模型的基础,采用基于图论的方法[14]来实现. 该方法将OCT图像表示为节点图,其中每个节点对应图像中的一个像素点,连接节点的链接称为边,一组连接的边形成一个穿过图的路径. 对每条边赋予权重,从设定的开始节点到结束节点遍历图,寻找权重总和最小的路径. 视网膜边界就是要寻找的最优路径. 在OCT图像中,视网膜层主要是水平结构,可通过垂直方向上像素灰度的变化来定义相邻节点之间边的权重. 基于灰度梯度的权重设置如下:
$$ w_{a b}=2-\left(g_{a}+g_{b}\right)+w_{\min } $$ (1) 式中,wab表示分配给相邻节点a和b之间边的权重,ga和gb分别表示节点a和节点b在图像中的垂直梯度,标准化后梯度值在0和1之间,wmin表示图中的最小权重,为一个小正数用以保证系统稳定,取wmin=1×10⁻⁵. 在该权重设置条件下,具有较大垂直梯度的节点对会赋予小的权重值,对应图像中就是视网膜边界点所在路径的权重和将会是最小的,依此来实现视网膜边界的提取.
视网膜层分割方法的整体流程和参考模型构建如图 2所示. 在提取边界的基础上,将获得的边界取平均作为正常视网膜参考模型,如图 3实线所示. 其中,图中虚线表示的是以参考模型标准差为参照的变化范围.
![]() 图 2 层分割整体流程和参考模型构建Figure 2. Layer segmentation overall process and reference model construction
图 2 层分割整体流程和参考模型构建Figure 2. Layer segmentation overall process and reference model constructionDuan等[15]和Shen等[16]对中国人正常黄斑厚度进行了测量统计,采用的仪器分别为Stratus OCT (Carl Zeiss Meditec Inc., Jena, Germany) 和Spectralis SD-OCT (Heidelberg Engineering, Heidelberg, Germany). 测量黄斑区直径6mm范围内的3个区域(中心、内环和外环,直径分别为1、3和6mm), 测量数据包括中心凹最小值、中心凹、内环和外环的平均厚度,具体数值如表 1所示. 其中Ref Model为从上述参考模型中量化得到的数值. 由于不同数据源和厚度计算方法、参考模型数值与文献中数值存在差异,但从整体看,与文献[15]和文献[16]数据分别呈现1.25∶1和1∶1.1的比例关系.
表 1 正常黄斑测量厚度与参考模型量化数值比较Table 1. Comparison between normal macular thickness and reference modelμm 测量途径 中心凹最小值 中心 内环 外环 Stratus OCT 150.3±18.1 176.4 ±17.5 255.3±14.9 237.7 ±12.4 Spectralis SD-OCT 215.4±13.6 257.9±19.2 339.2±14.6 299.1±14.3 Ref Model 202.6±12.5 233.6±15.0 313.7±15.5 286.5±21.9 2.2 计算机量化视网膜特征
视网膜的形态变化是眼底异常判断不可缺少的依据. 医生在观察分析OCT图像中视网膜形态变化时会重点关注视网膜厚度、边界平滑度以及边界连续性. 视网膜厚度特征T是眼科医生诊断眼底疾病时的重要指标,通过厚度特征的变化可以判断异常发生的位置及严重程度. 视网膜厚度数据的大小与眼底组织的真实情况,与仪器和仪器的实际操作有关,不具备特征量不变的特性,因此,厚度比特征R的定义可以更细致的描述视网膜几何特征和厚度变化情况. 梯度特征ΔY表示的是参数的变化率,曲率K是几何体不平坦程度的一种衡量,在本文中通过梯度与曲率特征可以较好的表达边界的平滑度. 标准差σ能反映一个数据集的离散程度,相关系数r是用以反映变量之间相关关系密切程度的统计指标,通过标准差与相关系数来判断目标边界与参考模型的相近程度及连续性. 综上,本文提出3类量化特征集,用以实现计算机量化医生关注的3种医学特征.
厚度特征的定义为各个区域的平均视网膜厚度,厚度比值特征定义为各个区域的平均视网膜厚度与黄斑小凹厚度比值,本文中将视网膜划分为6个区域,如图 1中所示.
形态特征的具体定义如下:
假设Yi为边界曲线(ILM, ISOS, BM)的离散数据,i = 1, 2, …W,W为图像水平方向像素个数,即图像的宽. 定义L为视网膜某一区域的水平长度,0 < L≤W.
定义区域平均曲率:
$$ K=\frac{\sum\limits_{i=1}^{L} K_{i}}{L}, K_{i}=\frac{\left|Y_{i}^{\prime \prime}\right|}{\sqrt{\left(1+Y_{i}^{\prime 2}\right)^{3}}} $$ (2) 其中,Y′i=Yi+1-Yi,Y″i=Y′i+1-Y′i=Yi+2-Yi.
定义区域平均水平梯度:
$$ \nabla Y=\frac{\sum\limits_{i=1}^{L} \nabla Y_{i}}{L}, \nabla Y_{i}=\frac{\partial Y_{i}}{\partial x}=Y_{i+1}-Y_{i} $$ (3) 假设Yiref为参考模型曲线的离散数据,Yitar为目标曲线的离散数据.
定义目标曲线与参考模型在某一区域内的相关系数:
$$ r=\frac{\sum\limits_{i=1}^{L}\left(Y_{i}^{\text {ref }}-\bar{Y}^{\text {ref }}\right)\left(Y_{i}^{\text {tar }}-\bar{Y}^{\text {tar }}\right)}{\sqrt{\sum\limits_{i=1}^{L}\left(Y_{i}^{\text {ref }}-\bar{Y}^{\text {ref }}\right)^{2} \cdot \sum\limits_{i=1}^{L}\left(Y_{i}^{\mathrm{tar}}-\bar{Y}^{\text {ar }}\right)^{2}}} $$ (4) 式中,Yref为Yiref在区域内的平均值,Ytar同理.
定义目标曲线与参考模型在某一区域内的标准差:
$$ \sigma=\sqrt{\frac{1}{L} \sum\limits_{i=1}^{L}\left(D_{i}-\bar{D}\right)^{2}} $$ (5) 式中,Di=Yitar-Yiref,D为Di在区域内的平均值.
3. 仿真研究
根据构建参考模型时所用的100张正常人眼的OCT图像,对这些特征进行统计分析与计算,可得到表 2视网膜厚度特征数据表和表 3视网膜厚度比值特征数据表. 这些数值可以为后续特征分析异常判别提供标准,同时也可以给医生提供参考数值.
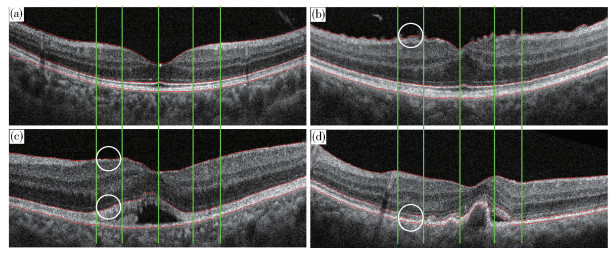
表 2 视网膜厚度特征数据表Table 2. Retinal thickness characteristic dataμm 计算机量化特征名称 参考模型数值 黄斑小凹平均厚度,TFov 206.8±13.2 左侧中心凹平均厚度,TFV_L 266.6±30.3 右侧中心凹平均厚度,TFV_R 269.7±31.2 左侧旁中心凹平均厚度,TPA_L 320.2±15.9 右侧旁中心凹平均厚度,TPA_R 319.3±15.6 左侧中心凹周围区平均厚度,TPE_L 296.1±20.8 右侧中心凹周围区平均厚度,TPE_R 295.5±20.1 表 3 视网膜厚度比值特征数据表Table 3. Retinal thickness ratio characteristics计算机量化特征名称 定义 参考模型数值 左侧中心凹厚度比,RFV_L TFV_L/TFov 1.29±0.15 右侧中心凹厚度比,RFV_R TFV_R/TFov 1.30±0.15 左侧旁中心凹厚度比,RPA_L TPA_L/TFov 1.55±0.10 右侧旁中心凹厚度比,RPA_R TPA_R/TFov 1.54±0.10 左侧中心凹周围区厚度比,RPE_L TPE_L/TFov 1.43±0.13 右侧中心凹周围区厚度比,RPE_R TPE_R/TFov 1.43±0.13 将参考模型应用于异常OCT图像的分析,如图 4所示,其中图 4(a)为正常视网膜图像,其余3张为异常图像. 以左侧旁中心凹区域(PA_L)为例,通过参考模型量化后的特征数值如表 4和表 5所示,其中Ref行表示的是参考模型特征数值. 当各图像对应的量化特征数值与该参考数值存在较大差别时,可以推断该特征数值存在异常. 例如,表 4中参考模型给出的黄斑小凹厚度TFov为206.8μm,而图 4(c)中该特征数值为325.0μm,两者之间存在较大差异,推断图例(c)存在异常可能性高,通过该量化方法可以表征图像中的异常. 为实现更加客观的判断,基于参考模型数值和一定数量的正常和异常图像量化数值,通过统计方法可以细化设定异常分类阈值,并可以进一步判断异常的严重程度.
![]() 图 4 异常OCT图像判别.(a) 正常视网膜图像;(b) 黄斑前膜异常图像;(c) 神经感觉层脱离异常图像;(d) 玻璃膜疣异常图像Figure 4. Abnormal OCT image discrimination: (a) normal retinal image; (b) abnormal image of macular epiretinal membrane; (c) abnormal image of neurosensory detachment; (d) abnormal image of drusen表 4 厚度特征数值比较Table 4. Comparison of the thickness characteristics
图 4 异常OCT图像判别.(a) 正常视网膜图像;(b) 黄斑前膜异常图像;(c) 神经感觉层脱离异常图像;(d) 玻璃膜疣异常图像Figure 4. Abnormal OCT image discrimination: (a) normal retinal image; (b) abnormal image of macular epiretinal membrane; (c) abnormal image of neurosensory detachment; (d) abnormal image of drusen表 4 厚度特征数值比较Table 4. Comparison of the thickness characteristics图 4 TFov TPA_L RPA_L (a) 205.6 304.9 1.48 (b) 304.8 341.0 1.12 (c) 325.0 391.3 1.20 (d) 181.8 343.2 1.88 Ref 206.8 320.2 1.55 表 5 形态特征数值比较Table 5. Comparison of the morphological characteristics边界 图 4 标准差 相关系数 正梯度 负梯度 曲率 (a) 1.29 0.99 0 -6.45 0.519 (b) 25.81 -0.55 2.80 -1.38 1.91 ILM (c) 22.47 -0.98 0.69 0 0.46 (d) 5.47 0.98 0 -5.37 0.37 Ref 0 1 0 -6.93 0.50 (a) 2.52 0.99 0 -4.56 0.79 (b) 2.68 0.99 0 -3.31 0.18 ISOS (c) 39.67 0.98 8.63 0 0.69 (d) 16.63 0.96 3.54 -9.78 6.55 Ref 0 1 0 -4.18 0.26 (a) 1.67 0.99 0 -5.16 0.45 (b) 1.96 0.99 0 -4.85 0.57 BM (c) 3.97 0.98 0 -3.06 1.15 (d) 3.49 0.96 0.51 -3.33 2.92 Ref 0 1 0 -4.46 0.30 各种眼底疾病既有个性又有共性,一方面某一特定的疾病可以具有独特的病理改变,另一方面某一病理改变又可以出现在很多疾病中. 针对特定具有独特病理改变的情况,通过重点关注及细化特征即可实现分类,例如图 4(b)是异常类别是黄斑前膜,病理改变为ILM表面不平整、褶皱,此时我们可以重点关注ILM所对应的曲率梯度等特征数值来区分是否出现黄斑前膜病理. 因为有某一病理改变出现在很多疾病,目前通过计算机来实现眼底疾病临床诊断还存在一定困难,但是通过细化各类疾病的病理特征,改善计算机识别能力,用以辅助医生诊断还是具有重要意义的.
4. 结论
(1) 提出了一种基于参考模型的视网膜特征量化方法. 在实现正常OCT图像中ILM、ISOS、BM边界分割提取的基础上,利用统计方法实现参考模型的构建.
(2) 结合眼科医生在临床诊断过程中所重点关注的视网膜厚度,边界平滑度以及边界连续性,基于参考模型提出了一系列利于视网膜异常判断的量化特征.
(3) 实验结果表明,参考模型量化特征除了可以为医生提供正常视网膜数值,还可以对比分析异常图像中病变发生的位置及严重程度,为后续异常判断提供基础.
-
![]()
图 1 视网膜黄斑区组织结构
ILM: 内界膜; RNFL: 视网膜神经纤维层; GCL+IPL: 神经节细胞层+内丛状层; INL: 内核层; OPL: 外丛状; ONL: 外核层; IS+OS: 光感受器内节段+光感受器外节段; RPE: 色素上皮层; VM: 维尔赫夫膜; BM: 布鲁赫膜; PE_L: 左侧中心凹周围区; PA_L: 左侧旁中心凹; FV_L: 左侧中心凹; FV_R: 右侧中心凹; PA_R: 右侧旁中心凹; PE_R: 右侧中心凹周围区
Figure 1. Macular tissue structure of the retina
![]()
图 2 层分割整体流程和参考模型构建
Figure 2. Layer segmentation overall process and reference model construction
![]()
图 4 异常OCT图像判别.(a) 正常视网膜图像;(b) 黄斑前膜异常图像;(c) 神经感觉层脱离异常图像;(d) 玻璃膜疣异常图像
Figure 4. Abnormal OCT image discrimination: (a) normal retinal image; (b) abnormal image of macular epiretinal membrane; (c) abnormal image of neurosensory detachment; (d) abnormal image of drusen
表 1 正常黄斑测量厚度与参考模型量化数值比较
Table 1 Comparison between normal macular thickness and reference model
μm 测量途径 中心凹最小值 中心 内环 外环 Stratus OCT 150.3±18.1 176.4 ±17.5 255.3±14.9 237.7 ±12.4 Spectralis SD-OCT 215.4±13.6 257.9±19.2 339.2±14.6 299.1±14.3 Ref Model 202.6±12.5 233.6±15.0 313.7±15.5 286.5±21.9  下载: 导出CSV
表 2 视网膜厚度特征数据表
Table 2 Retinal thickness characteristic data
μm 计算机量化特征名称 参考模型数值 黄斑小凹平均厚度,TFov 206.8±13.2 左侧中心凹平均厚度,TFV_L 266.6±30.3 右侧中心凹平均厚度,TFV_R 269.7±31.2 左侧旁中心凹平均厚度,TPA_L 320.2±15.9 右侧旁中心凹平均厚度,TPA_R 319.3±15.6 左侧中心凹周围区平均厚度,TPE_L 296.1±20.8 右侧中心凹周围区平均厚度,TPE_R 295.5±20.1
下载: 导出CSV
表 3 视网膜厚度比值特征数据表
Table 3 Retinal thickness ratio characteristics
计算机量化特征名称 定义 参考模型数值 左侧中心凹厚度比,RFV_L TFV_L/TFov 1.29±0.15 右侧中心凹厚度比,RFV_R TFV_R/TFov 1.30±0.15 左侧旁中心凹厚度比,RPA_L TPA_L/TFov 1.55±0.10 右侧旁中心凹厚度比,RPA_R TPA_R/TFov 1.54±0.10 左侧中心凹周围区厚度比,RPE_L TPE_L/TFov 1.43±0.13 右侧中心凹周围区厚度比,RPE_R TPE_R/TFov 1.43±0.13
下载: 导出CSV
表 4 厚度特征数值比较
Table 4 Comparison of the thickness characteristics
图 4 TFov TPA_L RPA_L (a) 205.6 304.9 1.48 (b) 304.8 341.0 1.12 (c) 325.0 391.3 1.20 (d) 181.8 343.2 1.88 Ref 206.8 320.2 1.55
下载: 导出CSV
表 5 形态特征数值比较
Table 5 Comparison of the morphological characteristics
边界 图 4 标准差 相关系数 正梯度 负梯度 曲率 (a) 1.29 0.99 0 -6.45 0.519 (b) 25.81 -0.55 2.80 -1.38 1.91 ILM (c) 22.47 -0.98 0.69 0 0.46 (d) 5.47 0.98 0 -5.37 0.37 Ref 0 1 0 -6.93 0.50 (a) 2.52 0.99 0 -4.56 0.79 (b) 2.68 0.99 0 -3.31 0.18 ISOS (c) 39.67 0.98 8.63 0 0.69 (d) 16.63 0.96 3.54 -9.78 6.55 Ref 0 1 0 -4.18 0.26 (a) 1.67 0.99 0 -5.16 0.45 (b) 1.96 0.99 0 -4.85 0.57 BM (c) 3.97 0.98 0 -3.06 1.15 (d) 3.49 0.96 0.51 -3.33 2.92 Ref 0 1 0 -4.46 0.30
下载: 导出CSV
-
[1] Huang D, Swanson E A, Lin C P, et al. Optical coherence tomography. Science, 1991, 254(5035): 1178 doi: 10.1126/science.1957169
[2] Virgili G, Menchini F, Casazza G, et al. Optical coherence tomography (OCT) for detection of macular oedema in patients with diabetic retinopathy. Cochrane Database Syst Rev, 2015(1): CD008081 http://www.ncbi.nlm.nih.gov/pubmed/25564068
[3] Ouyang Y, Heussen F M, Hariri A, et al. Optical coherence tomography-based observation of the natural history of drusenoid lesion in eyes with dry age-related macular degeneration. Ophthalmology, 2013, 120(12): 2656 doi: 10.1016/j.ophtha.2013.05.029
[4] Andreoli M T, Lim J I. Optical coherence tomography retinal thickness and volume measurements in X-linked retinoschisis. Am J Ophthalmol, 2014, 158(3): 567 doi: 10.1016/j.ajo.2014.05.028
[5] Roh Y R, Park K H, Woo S J. Foveal thickness between stratus and spectralis optical coherence tomography in retinal diseases. Korean J Ophthalmol, 2013, 27(4): 268 doi: 10.3341/kjo.2013.27.4.268
[6] Liu Y Y, Chen M, Ishikawa H, et al. Automated macular pathology diagnosis in retinal OCT images using multi-scale spatial pyramid and local binary patterns in texture and shape encoding. Med Image Anal, 2011, 15(5): 748 doi: 10.1016/j.media.2011.06.005
[7] Liu Y Y, Ishikawa H, Chen M, et al. Computerized macular pathology diagnosis in spectral domain optical coherence tomography scans based on multiscale texture and shape features. Invest Ophthalmol Vis Sci, 2011, 52(11): 8316 doi: 10.1167/iovs.10-7012
[8] Koprowski R, Teper S, Wrobel Z, et al. Automatic analysis of selected choroidal diseases in OCT images of the eye fundus. BioMed Eng OnLine, 2013, 12: 117 doi: 10.1186/1475-925X-12-117
[9] Xu J, Ishikawa H, Wollstein G, et al. Three-dimensional spectral-domain optical coherence tomography data analysis for glaucoma detection. PLoS One, 2013, 8(2): e55476 doi: 10.1371/journal.pone.0055476
[10] Koprowski R, Rzendkowski M, Wrobel Z. Automatic method of analysis of OCT images in assessing the severity degree of glaucoma and the visual field loss. BioMed Eng OnLine, 2014, 13: 16 doi: 10.1186/1475-925X-13-16
[11] Chen H Y, Chen X J, Qiu Z Q, et al. Quantitative analysis of retinal layers' optical intensities on 3D optical coherence tomography for central retinal artery occlusion. Sci Rep, 2015, 5(10): 9269 http://pubmedcentralcanada.ca/pmcc/articles/PMC4363859/
[12] Hu Z H, Shi Y, Nandanan K, et al. Semiautomated segmentation and analysis of retinal layers in three-dimensional spectral-domain optical coherence tomography images of patients with atrophic age-related macular degeneration. Neurophotonics, 2017, 4(1): 011012 doi: 10.1117/1.NPh.4.1.011012
[13] Rashno A, Koozekanani D D, Drayna P M, et al. Fully automated segmentation of fluid/cyst regions in optical coherence tomography images with diabetic macular edema using neutrosophic sets and graph algorithms. IEEE Trans Biomed Eng, 2018, 65(5): 989 http://europepmc.org/abstract/MED/28783619
[14] Chiu S J, Allingham M J, Mettu P S, et al. Kernel regression based segmentation of optical coherence tomography images with diabetic macular edema. Biomed Opt Exp, 2015, 6(4): 1172 doi: 10.1364/BOE.6.001172
[15] Duan X R, Liang Y B, Friedman D S, et al. Normal macular thickness measurements using optical coherence tomography in healthy eyes of adult Chinese persons: the Handan Eye Study. Ophthalmology, 2010, 117(8): 1585 doi: 10.1016/j.ophtha.2009.12.036
[16] Shen L, Gao F, Xu X L, et al. Macular thickness in Chinese. Acta Ophthalmol, 2013, 91(1): e77 doi: 10.1111/j.1755-3768.2012.02428.x
-
期刊类型引用(1)
1. 徐衍睿,班晓娟,王笑琨,王宇,尹豆,周靖,黄厚斌,朱志鸿. 面向视网膜脱离手术的硅油填充模拟. 工程科学学报. 2021(09): 1233-1243 .  本站查看
本站查看
其他类型引用(1)
计量
- 文章访问数: 1313
- HTML全文浏览量: 378
- PDF下载量: 33
- 被引次数: 2
